Jobs represent server caches for unique pipeline datasets with qualifying variable values, Node Variables (nod2eVars), or Secured Variables (secVars). Because a dataset with a nodeVar may have different results for each value, and multiple sessions may need the results for different nodeVars at the same time, each set of a unique dataset and variable values gets separate handling on the server, called a job. Job Status shows the job updates (queries, web retrievals, etc.) that have been or are scheduled to be performed by the server, and each job update will update the value of a single job cache.
An example of a job would be a query against a database. When a user views a page, they “subscribe” to the data that is presented on that page. This means that when a user views a page, the corresponding pipeline nodes for the Visualizations on that page will have at least one job, and the job will have run at least one update.
These job updates are what appear on the Job Status page.
Example

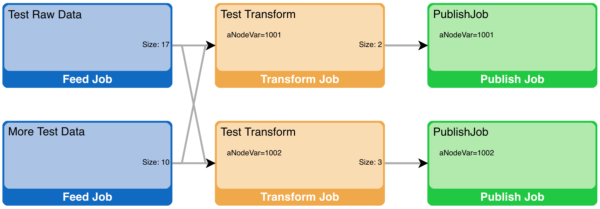
This example above shows a simple pipeline to illustrate some of the concepts behind datasets and jobs. The pipeline above contains two feeds: “Test Raw Data” and “More Test Data”. These feeds will each produce their own tabular data sets.
There is also a transform, called “Test Transform”, that joins the data from both feeds together. The “Test Transform” node has been annotated to show that it is filtered by a variable called “aNodeVar”. This means that the records in the resulting data set will be filtered by some value used inside that SQL Query.
Finally, a Visualization has been configured off of “Test Transform”. The “Test Table” visualization shows how nodeVar values impact jobs.
Assume the Test Table is viewed twice (simultaneously) using different nodeVar values. Whether by different user sessions, the same session in multiple tabs, or the on same page, the jobs needed to fulfill the data requests are as follows:

This job topology represents the actual data retrievals that were performed, and how each is interconnected. Starting from the right:
- Publish Jobs: There are two publish jobs, which represent the two subscriptions made by the two tables being displayed. Note that each has a different nodeVar value.
- Transform Jobs: Each accessed table queries the same pipeline dataset, but because there are two nodeVars being used, there are two required transform jobs.
- Feed Jobs: Because the feeds do not use nodeVars, the job and therefore the data cache for each is shared by both the downstream transform jobs.
In a large system, the queries will often overlap with queries requested by other users. By sharing all the jobs that are possible, the system reduces both the data caches and the queries required to update the caches.
Viewing Job Status
You can view Job Status for a selected pipeline by clicking the ![]() button on any pipeline node. This shows the recent and waiting updates for each job.
button on any pipeline node. This shows the recent and waiting updates for each job.

You can also access an unfiltered Job Status view for the entire system through the System Menu.
System > Job Status
User Interface
Job status appears in a tabular format.

If you select an individual Job, you can toggle to a Topology view of that job using the toggle control at the top left.

Job Name
The job name corresponds to the name of a pipeline node.
Job Vars
This indicates any variables used in the job.
Result
- Waiting – This update is scheduled to run in the future.
- In Progress – This job update is currently running.
- Updated – The update has finished, and data was updated for the job.
- Updated, Unchanged – This update of the job resulted in data unchanged from the previous update. Downstream jobs will not be updated.
- Error – There was an error updating the data.
- Source(s) Unchanged – The job is for a transform, and none of the upstream jobs have data that have changed since the last update.
- Canceled – This job update was canceled because the data was unsubscribed before it ran.
Record Count
The number of data records (rows) in the results.
Total Time (ms)
The total amount of time it took for the server to complete the job. This is based off the “Scheduled” timestamp and incorporates any time spent waiting on other jobs to complete.
Update (ms)
The actual amount of time it took for the server to perform this specific job. This is based on the “Started” timestamp.
Scheduled
A timestamp indicating when a job should start.
Started
A timestamp indicating when a job actually started.
Completed
A timestamp indicating when a job has been completed.
Task History
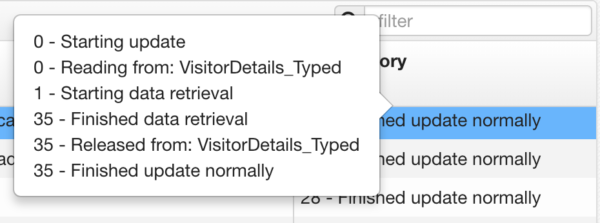
This shows the current status of the job. If you hover over the current value, a historical list will appear with associated times.
The number at the left represents the number of milliseconds from the start of the update.

Viewing Job Statuses via Data Feeds
Within the pipeline itself, there is a Job Status Connection and three Job Status Feeds derived from that Connection. Each of these nodes is included by default:
- All Job Statuses provides the raw jobs data
- Job Status Metrics by Job Key provides summarized job data grouped by job key (a combination of the producer name and any parameters or security parameters)
- Job Status Metrics by Producer Name provides summarized job data grouped by producer name
The summary data feeds to look at the jobs that have finished (either in the success or in failure), and provide both information about recent job successes and failures, as well as average time metrics for the successful job runs.
As system constructs, the Connection and Feeds do not require a license, and they can also not be edited or modified within the browser. They do, however, allow for attaching of Transforms and Visualizations. The Feeds are also set with a default polling period of 30 seconds. This can be modified in local.properties, e.g. data.feed.type.job-status.property.poll.defaultValue=15.
Additionally, the Connection and Feeds are not exported to archives, but any child nodes (i.e. Transforms and Visualizations) are, and the children should be appropriately reconnected to their parents upon being restored.
Job Status Icon in the Pipeline
The summary data from Job Status Metrics by Producer Name, specifically “Last Job Succeeded” and “Last Run”, is used to provide status information for the pipeline nodes. For any given Feed or Transform, hovering over the node will display a tooltip indicating whether the node’s last job succeeded or failed along with a timestamp of when that status was recorded. If the node’s job has not run recently enough to provide an indication of success or failure, the tooltip will specify as such.
In the event that a node’s most recent job has failed, the node will appear transparent:

Clicking on the error icon will generate a tooltip that contains a clickable link to the Job Status page with the filter set to the ID of the node in question.
The node status data that is used for the pipeline icon is cached and updated every 30 seconds (this property is set as pipeline.node.health.update=*/30 * * * * *). To change the scheduling of this task, pipeline.node.health.update should be set to the desired cron value in local.properties. The node status data can also be manually refreshed by clicking the refresh button at the top-right of the pipeline, immediately adjacent to the filter control.
