External Metrics Available via Prometheus
The table below lists the available metrics that are scraped by Prometheus.
There are three different types of metrics:
- Gauges: Track the current value (like memoryUsed, number of users, etc) at a current time.
- Counters: Track how many times an activity has occurred.
- Timers: Track the length of time spent performing a given activity. This provides a counter for how many times, sum total of time spent, maximum time spent of the longest recorded time.
| EdgeCore Version: | |||||
| Metric Name | Metric Description | Metric Type | 3.9.0 | 3.9.1 | 3.11.0 |
| hikaricp_connections | Total number of available hikaricp connections | gauge | X | X | X |
| hikaricp_connections_acquire_seconds_count | Time it took to acquire connection | summary | X | X | X |
| hikaricp_connections_acquire_seconds_max | Time it took to acquire connection | gauge | X | X | X |
| hikaricp_connections_acquire_seconds_sum | Time it took to acquire connection | gauge | X | X | X |
| hikaricp_connections_active | Total number of active hikaricp connections | gauge | X | X | X |
| hikaricp_connections_creation_seconds_count | Total count of time it took to create connection | summary | X | X | X |
| hikaricp_connections_creation_seconds_max | Maximum time it took to create connection | gauge | X | X | X |
| hikaricp_connections_creation_seconds_sum | Total time it took to create all connections | summary | X | X | X |
| hikaricp_connections_idle | Number of Idle connections | gauge | X | X | X |
| hikaricp_connections_max | Maximum number of connections | gauge | X | X | X |
| hikaricp_connections_min | Minimum number of connections | gauge | X | X | X |
| hikaricp_connections_pending | Number of threads currently in pending state | gauge | X | X | X |
| hikaricp_connections_timeout_total | Total timeout time of all connections | counter | X | X | X |
| hikaricp_connections_usage_seconds_count | Connection usage time | summary | X | X | X |
| hikaricp_connections_usage_seconds_max | Maximum connection usage time | gauge | X | X | X |
| hikaricp_connections_usage_seconds_sum | Total sum of connection usage time | summary | X | X | X |
| http_server_requests_seconds_count | Shows count for specific HTTP request along with rest of that request data | summary | X | X | X |
| http_server_requests_seconds_max | Shows maximum http requests duration along with rest of the request data | gauge | X | X | X |
| http_server_requests_seconds_sum | Shows a sum of seconds taken on specific HTTP request | summary | X | X | X |
| jdbc_connections_active | Total number of active JDBC connections recorded | gauge | X | X | X |
| jdbc_connections_max | Maximum number of JDBC connections recorded | gauge | X | X | X |
| jdbc_connections_min | Minimum number of JDBC connections recorded | gauge | X | X | X |
| job_data_size_memory | Memory usage for specific job | gauge | X | X | X |
| job_data_size_results | How many records were retrieved by specific job | gauge | X | X | X |
| job_timer_seconds_count | Time it took to execute job in seconds | summary | X | X | X |
| job_timer_seconds_max | Maximum tIme it took to execute job in seconds | gauge | X | X | X |
| job_timer_seconds_sum | Total time it took to execute job in seconds | summary | X | X | X |
| jobs_size | How many jobs were run | gauge | X | X | X |
| jobs_taskstatus_size | Contains information about jobs that were run | gauge | X | X | X |
| jvm_buffer_count_buffers | An estimate of the number of buffers in the pool | gauge | X | X | X |
| jvm_buffer_memory_used_bytes | An estimate of the memory that the Java virtual machine is using for this buffer pool | gauge | X | X | X |
| jvm_buffer_total_capacity_bytes | An estimate of the total capacity of the buffers in this pool | gauge | X | X | X |
| jvm_classes_loaded_classes | The number of classes that are currently loaded in the Java virtual machine | gauge | X | X | X |
| jvm_classes_unloaded_classes_total | The total number of classes unloaded since the Java virtual machine has started execution | counter | X | X | X |
| jvm_gc_live_data_size_bytes | Size of old generation memory pool after a full GC | gauge | X | X | X |
| jvm_gc_max_data_size_bytes | Maximum size of old generation memory pool | gauge | X | X | X |
| jvm_gc_memory_allocated_bytes_total | Incremented for an increase in the size of the young generation memory pool after one GC to before the next | counter | X | X | X |
| jvm_gc_memory_promoted_bytes_total | Count of positive increases in the size of the old generation memory pool before GC to after GC | counter | X | X | X |
| jvm_gc_pause_seconds_count | Number of times spent in GC pause | summary | X | X | X |
| jvm_gc_pause_seconds_max | Maximum time spent in GC pause in seconds | gauge | X | X | X |
| jvm_gc_pause_seconds_sum | Total time spent in GC pause in seconds | summary | X | X | X |
| jvm_memory_committed_bytes | The amount of memory in bytes that is committed for the Java virtual machine to use | gauge | X | X | X |
| jvm_memory_max_bytes | The maximum amount of memory in bytes that can be used for memory management | gauge | X | X | X |
| jvm_memory_used_bytes | The amount of used memory | gauge | X | X | X |
| jvm_threads_daemon_threads | The current number of live daemon threads | gauge | X | X | X |
| jvm_threads_live_threads | The current number of live threads including both daemon and non-daemon threads | gauge | X | X | X |
| jvm_threads_peak_threads | The peak live thread count since the Java virtual machine started or peak was reset | gauge | X | X | X |
| jvm_threads_states_threads | The current number of threads having NEW state | gauge | X | X | X |
| log4j2_events_total | Number of fatal level log events | counter | X | X | X |
| pageaccess_total | Number of accessed page per page | counter | X | X | X |
| process_cpu_usage | The “recent CPU usage” for the Java Virtual Machine process | gauge | X | X | X |
| process_files_max_files | The maximum file descriptor count | gauge | X | X | X |
| process_files_open_files | The open file descriptor count | gauge | X | X | X |
| process_start_time_seconds | Start time of the process since unix epoch | gauge | X | X | X |
| process_uptime_seconds | The uptime of the Java virtual machine | gauge | X | X | X |
| sessions_active | Number and info of active sessions | gauge | X | X | X |
| sessions_login_total | Number and info of logins and users | counter | X | X | X |
| system_cpu_count | The number of processors available to the Java virtual machine | gauge | X | X | X |
| system_cpu_usage | The “recent CPU usage” for the whole system | gauge | X | X | X |
| system_load_average_1m | The sum of the number of runnable entities queued to available processors and the number of runnable entities running on the available processors averaged over a period of time | gauge | X | X | X |
| tomcat_global_error_total | The number of errors generated by server requests | counter | X | X | X |
| tomcat_global_received_bytes_total | Total number of bytes received from requests | counter | X | X | X |
| tomcat_global_request_max_seconds | Maximum time it took to run specific request | gauge | X | X | X |
| tomcat_global_request_seconds_count | The number of requests across all connectors | summary | X | X | X |
| tomcat_global_request_seconds_sum | Total time it took to run requests | summary | X | X | X |
| tomcat_global_sent_bytes_total | Total number of bytes sent from requests | counter | X | X | X |
| tomcat_threads_busy_threads | Current number of busy threads | gauge | X | X | X |
| tomcat_threads_config_max_threads | The maximum number of threads created by the connector and made available for requests | gauge | X | X | X |
| tomcat_threads_current_threads | Current number of used threads by requests | gauge | X | X | X |
EdgeCore 4.3.4 Version
Client-side Metrics
To enable tracking, set the following in local.properties or custom.properties configuration file:
metrics.trackClientActivity=true
Client-side metrics are listed in the following table:
| Metric Name | Metric Description & Example | Metric Type |
client_pageaccess_seconds_sum |
Total time the user was on a page
client_pageaccess_seconds_sum{application=”edgeCore, |
Timer (sum) |
client_pageaccess_seconds_count |
Number of times the user went on a page
client_pageaccess_seconds_count{application=”edgeCore”, |
Timer (count) |
client_pageaccess_seconds_max |
The longest the user was on a page
client_pageaccess_seconds_max{application=”edgeCore”, |
Timer (max) |
client_clientfilter_total |
Number of times a client filter was used
client_clientfilter_total{Name=”Sort Filter”,application=”edgeCore”, |
Counter |
client_backforward_total |
Number of times a user performed an action to go back to the previous page or move forward
client_backforward_total{application=”edgeCore”, |
Counter |
client_menubar_total |
Number of times a user visited a page displayed in the menu bar
client_menubar_total{application=”edgeCore”, |
Counter |
client_breadcrumb_total |
Number of times a user visited the page set as the breadcrumb home icon link by clicking the home icon from any page
client_breadcrumb_total{application=”edgeCore”, |
Counter |
client_action_total |
Number of times a user performed a client action, excludes hover actions
client_action_total{actionName=”showWidget”, |
Counter |
client_visualization_total |
Number of times a user visited a visualization
client_visualization_total{application=”edgeCore”, |
Counter |
Additionally, the client-side metrics are enriched by adding tags to track pageId, pagePath, and any pageVars on the page that are configured to be tracked.
Tracking Page Variables
You can select which page variables will be tracked.
In order for a page variable to be tracked, you need to enable the Metric Tracking toggle switch as shown in the following screenshot.
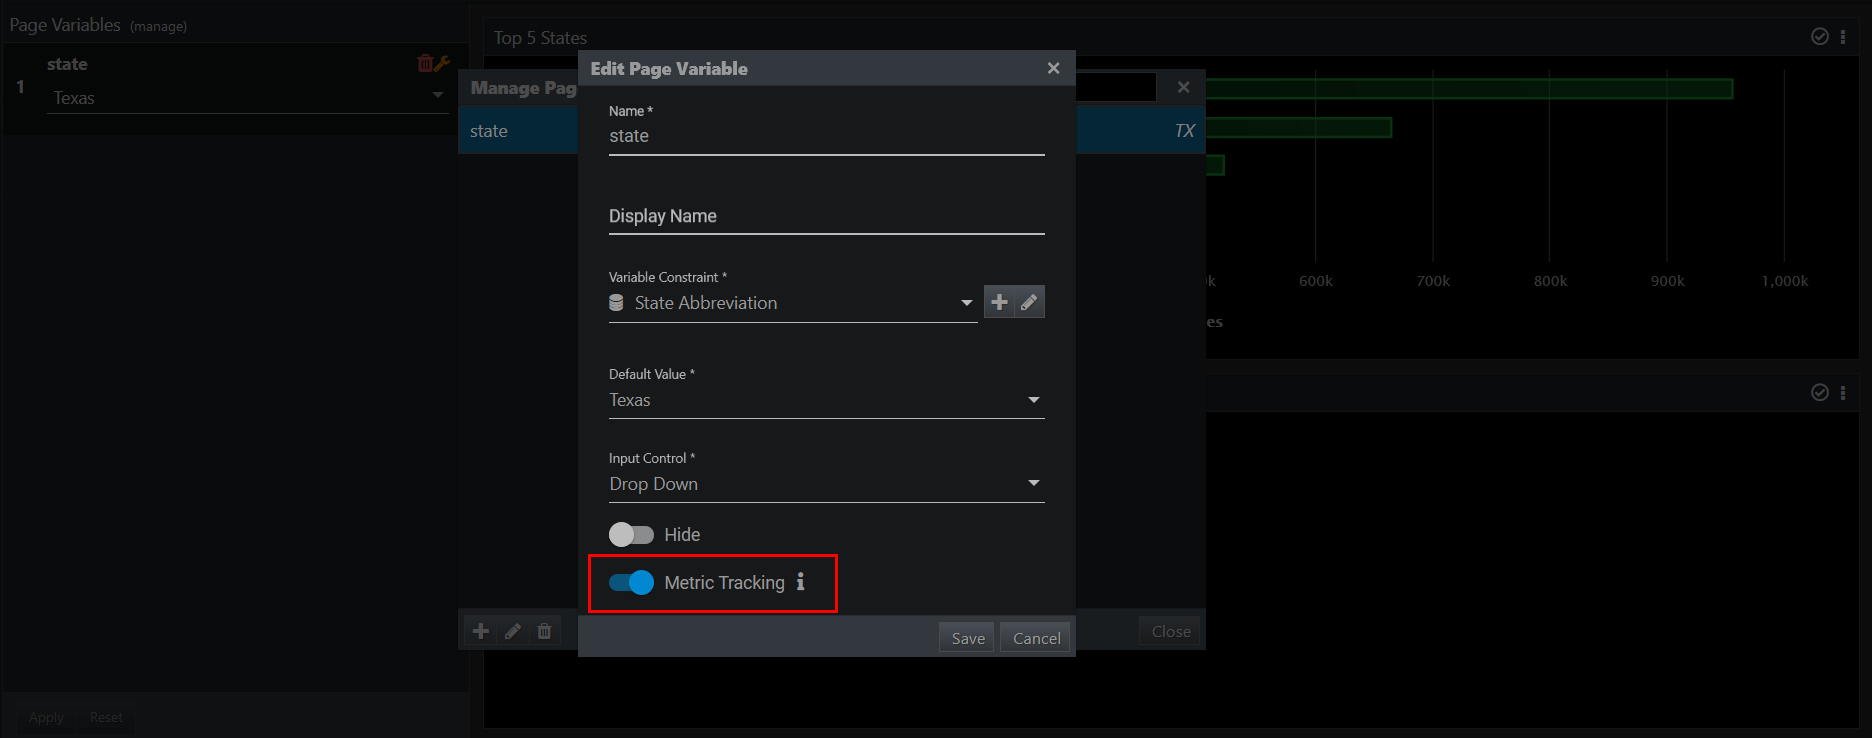
Example:
client_pageaccess_seconds_count{application="edgeCore",cluster="standalone",domain="default",isAdmin="true",pageId="kphlbn-n7qlj6j2vutl",pagePath="states",pageVars="state=TX",user="admin",} 2.0
Server-side Metrics
Server-side metrics are listed in the following table:
| Metric Name | Metric Description & Example | Metric Type |
users |
Number of users in the system
users{application=”edgeCore”,cluster=”standalone”,} 3.0 |
Gauge |
roles |
Number of roles in the system
roles{application=”edgeCore”,cluster=”standalone”,} 4.0 |
Gauge |
domains |
Number of domains in the system
domains{application=”edgeCore”,cluster=”standalone”,} 1.0 |
Gauge |
session_seconds_count |
Number of times the user logged in the system
session_seconds_count{application=”edgeCore”,cluster=”standalone”, |
Timer (count) |
session_seconds_sum |
The total time the user has been logged in
session_seconds_sum{application=”edgeCore”,cluster=”standalone”, |
Timer (sum) |
session_seconds_max |
The longest session the user had
session_seconds_max{application=”edgeCore”,cluster=”standalone”, |
Timer (max) |
Tracking HelloWorld Custom Visualization
The helloWorldCustom_total metric (type counter) tracks the number of times the helloWorld custom visualization/extension was used.
Example:
helloWorldCustom_total{application="edgeCore",cluster="standalone",domain="default",height="275.183",isAdmin="true",pageId="kphlbn-n7qlj6j2nbqh",pagePath="test",pageVars="state=FL",user="admin",width="1099.8",} 2.0
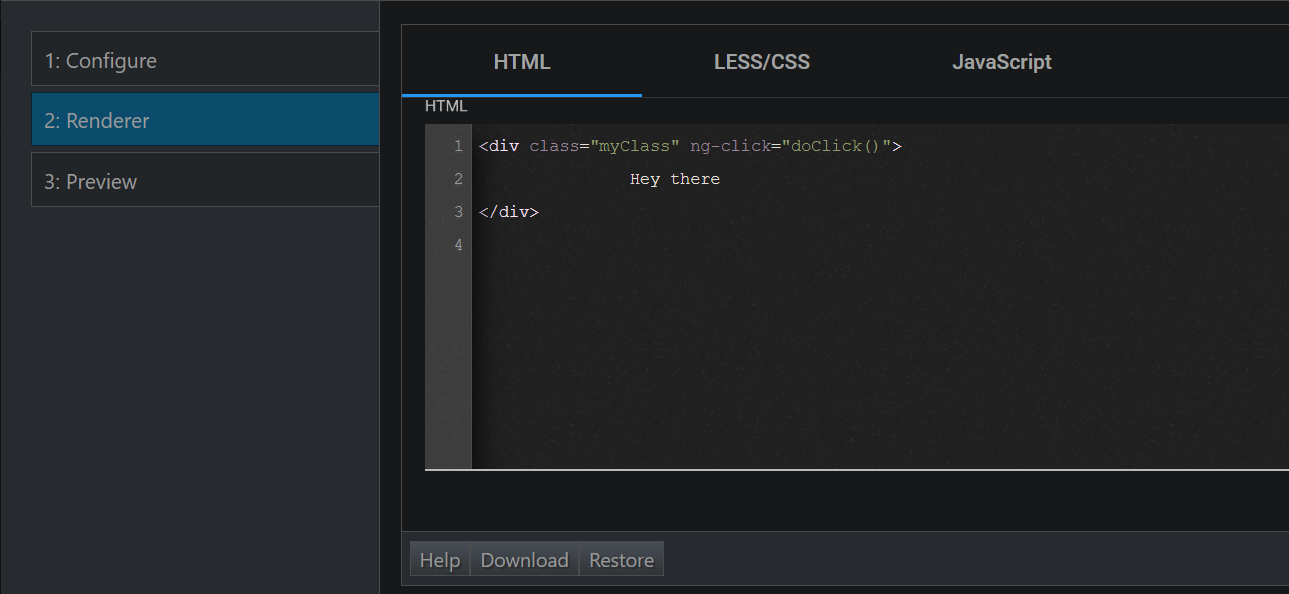
Tracking HTML Template
You can track the number of times the HTML template is used.
To do so, use the following format:
component.track('metric name','key','value');
Note: the metric name must be filled out, while the key/value pair can be used as additional tags to enrich the metric. By default, the active pagePath, pageId, and pageVars configured for tracking will be used to enrich the timed meter.
Additionally, the key may be a button, while the value might track which button was clicked on the HTML Template Visualization.
Important: Any additional key/value pairs must be consistently used for each uniquely named metric. If you do not use a consistent set of key names and non-null values, the meter will fail to track the request.
Example:
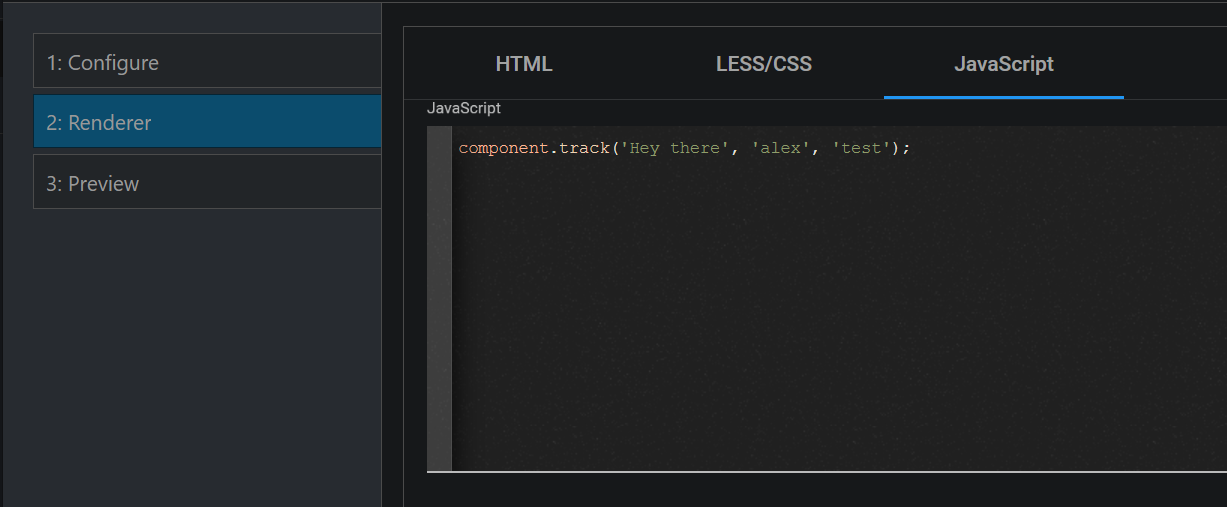
Hey_there_total{alex="test",application="edgeCore",cluster="standalone",domain="default",isAdmin="true",pageId="kphlbn-n7qlj6j2vutl",pagePath="testpage",pageVars="state=TX",user="admin",} 1.0
Hey_there_total{alex="test",application="edgeCore",cluster="standalone",domain="default",isAdmin="true",pageId="gtqueu-ednpd7cu64mi",pagePath="newpage",pageVars="empty",user="admin",} 1.0
EdgeCore 4.3.9 Version
RPA Metrics
RPA metrics are listed in the following table:
| Metric Name | Metric Description & Example | Metric Type |
rpametrics_seconds_sum |
Total time it took for the script to be executed
rpametrics_seconds_sum{application=”edgeCore”, |
Timer (sum) |
rpametrics_seconds_count |
Number of times the script was executed
rpametrics_seconds_count{application=”edgeCore”, |
Timer (count) |
rpametrics_seconds_max |
Maximum time taken to execute a script
rpametrics_seconds_max{application=”edgeCore”, |
Timer (max) |