For the purpose of this example, we are going to create a simple data processing pipeline that pulls data from a database, transforms it using JavaScript, and writes back updated values.
Step 1: Create H2 Database Connection
- Go to the Pipeline.
- Click + Add Connection in the upper-left corner.
A pop-up for choosing a connection type is displayed. - In the pop-up, select Database / H2 connection type.
- Click Use Selected.
A new page is displayed. - In Connection Name, enter a name for the connection (for example, H2KPI).
- Make sure the Enable Connection toggle is on.
- In Endpoint, provide the following:
a) the URL corresponding to your H2 database instance (e.g. jdbc:h2:/Users/…)
b) username
c) password
d) pool size, that is, the number of database connections allowed for this pool (for the purpose of this example, you can leave the default value of 10) - Click Next.
You are taken to the Test Connection tab where the confirmation message Connection test was successful is displayed. - Click Save and Close.
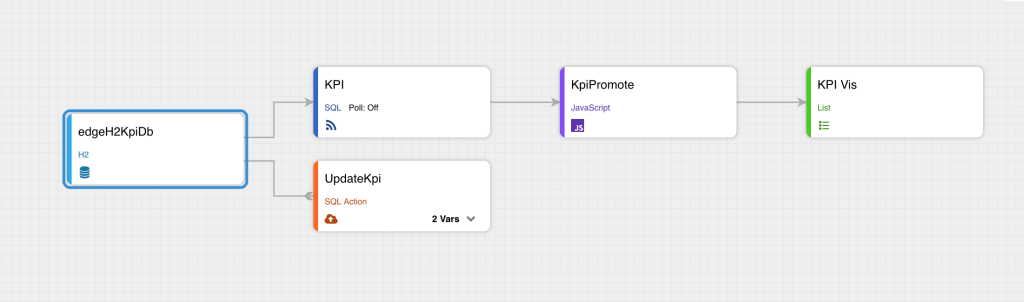
The newly created connection is displayed in the Pipeline.
Step 2: Set up Scripts to Create KPI Table and Populate via SQL
For the purpose of this example, we have used the following:
CREATE TABLE KPI_Table (
KPI_Metric VARCHAR(255) NOT NULL,
Target DECIMAL(10, 2),
Actual DECIMAL(10, 2),
Variance DECIMAL(10, 2),
Trend VARCHAR(50),
Status VARCHAR(50),
Owner VARCHAR(100),
Reporting_Period DATE
);

INSERT INTO KPI_Table (
KPI_Metric,
Target,
Actual,
Owner,
Reporting_Period
) VALUES (
'Website Conversion Rate',
2.5,
2.1,
'Marketing Department',
CURRENT_DATE()
);
Step 3: Define Feed to Pull Data
- Go to the pipeline again and find the H2 connection you have previously created.
- Hover over the connection for the gear icon to appear on the right.
- Click the gear icon button in the connection box and select + New Feed.
A page for creating SQL feed is displayed. - Provide a feed name (e.g. KPI).
- Click Next to go to Query.
- In Query, enter the following:
SELECT * FROM KPI_Table
- Click Next. You are taken to Published Attributes where the attributes from the table are displayed. No action is needed here, so click Next to go to Data Preview where you can observe the data preview of your SQL feed.
- Click Save and Close.
The newly created feed is displayed in the Pipeline.
Step 4: Define SQL Action to Update KPI Table
Here we are going to have two node vars: one with updated value, and the other with a key to identify record(s) to update.
- Go to the pipeline again and find the H2 connection you have previously created.
- Hover over the connection for the gear icon to appear on the right.
- Click the gear icon button in the connection box and select + New Server Action.
A page for creating SQL action is displayed. - Provide an action name (e.g. Update KPI).
- Click Next to go to Statement.
- In Statement, do the following:
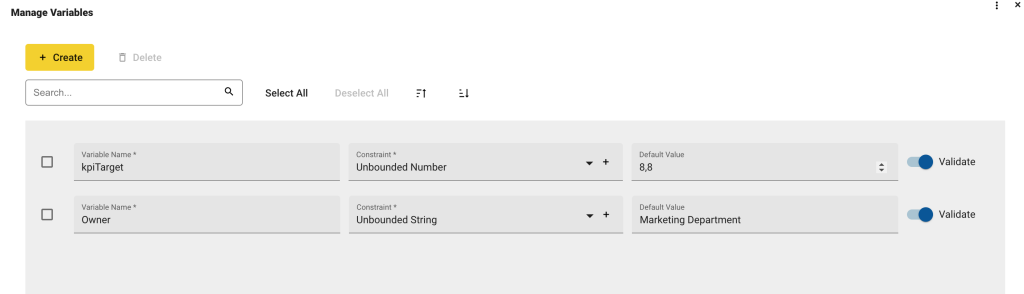
a) Click Manage Variables and then + Create twice, as you need to create two node variables just like in the following screenshot.
b) Save your variables to go back to Statement.
c) In Script, we are going to use the node variables we have just created:UPDATE KPI_Table SET Target = CAST({safeNodeVar.kpiTarget} AS DECIMAL(10,2)) WHERE Owner = {safeNodeVar.Owner} - Click Test Server Action.
The status should be SUCCEEDED. - Close the pop-up and click Save and Close.
The newly created action is displayed in the Pipeline.
Step 5: Create Javascript Transform
The JS transform will take KPI feed records and call SQL action to update (adds 2 to the current value).
- In the pipeline, find the SQL feed you have created.
- Hover over the created SQL feed for the gear icon to appear on the right, click the gear icon button in the connection box and select + New Transform.
A pop-up for choosing a Transform Type is displayed. - In the pop-up, select JavaScript.
A new page is displayed. - In Configure, provide a Transform Name (e.g. KPI promote) and click Next to go to Script References.
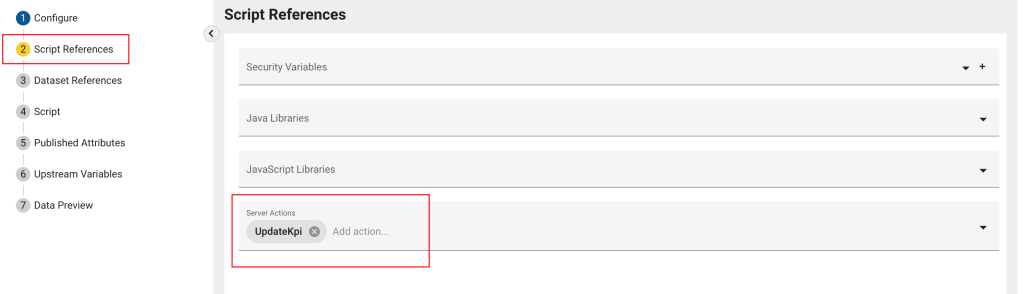
- In Script References, go to Server Actions at the bottom and add the server action you have created in Step 4.
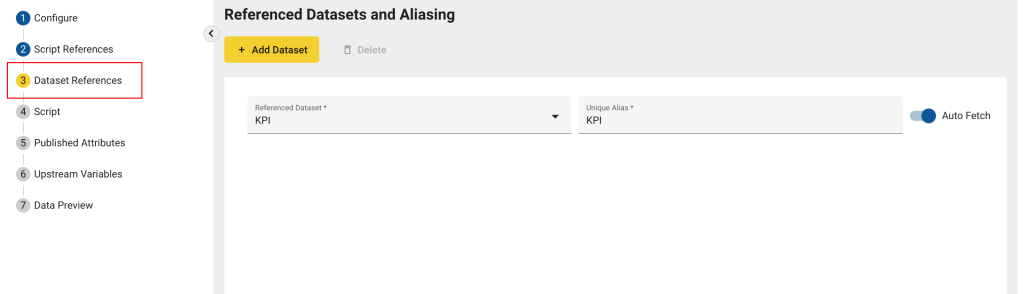
- Click Next to go to Dataset References.
Make sure the dataset is displayed.
- Click Next to go to Script.
- In Script, delete the default script and paste the following:
function getAttributes(sourceAttrs, nodeVars, secVars, sourceRecords, transformName) { // sourceAttrs, sourceRecords: arrays containing arrays of objects representing source attributes & records // the numerical indices of the arrays correspond to the sources in the producers list // nodeVars, secVars: objects whose named properties correspond to the values of any declared node or secured variables // TODO: Create an array of attribute objects // The following example combines all sourceAttrs into a single list var attributes = []; sourceAttrs[0].forEach(function(attr) { // Read/write properties include: name, type, isId, units, format // Read-only properties include: producerName, sourceName, ordinalPosition attributes.push(attr); }); return jsAttributesSuccess(attributes, "Example Success"); // can optionally return jsAttributesFailure(failureMsg) to handle failures } function getRecords(sourceRecords, nodeVars, secVars, attributes, transformName) { // sourceRecords: an array containing arrays of objects, with sourceRecords[0] == array of record objects for first source // nodeVars, secVars: objects whose named properties correspond to the values of any declared node or secured variables // attributes: an array of attribute objects, equivalent to the attributes result from the getAttributes function // TODO: Create an array of record objects // The following example combines all sourceRecords into a single list var records = []; sourceRecords[0].forEach(function(record) { // Any existing attributes on the record can be accessed via record.attrName // Additionally, records can receive values for any new attributes defined in getAttributes record.foo = "bar_" + (Math.floor(Math.random()*1000)+1); records.push(record); var actionDO = serverActionService.getPersistedActionByName("UpdateKpi"); var params = makeParameterValueList( { //Define here the values for nodeVars in the server action "kpiTarget":record.TARGET + 2, "Owner":record.OWNER }); logger.info("Running UpdateKpi using nodeVars: " + JSON.stringify(params)); var actionResponseDO = serverActionService.invokeServerActionByAction(actionDO, params, null); logger.info(actionResponseDO.getStatus()); }); return jsRecordsSuccess(records, "Example Success"); // can optionally return jsRecordsFailure(failureMsg) to handle failures } - Click Next to go to Published Attributes. Here you can see all discovered attributes. No changes are needed here.
- Click Next to proceed to Data Preview where you should see the end result.
- Click Save and Close.
The newly created transform is displayed in the Pipeline.
Step 6: Create Visualization
As the final step, visualize your data by using one of the many visualizations provided by edgeCore.