Related pages:
- Custom Visualizations Overview and Prerequisites
- Generating a Custom Visualization
- Generating a Custom Visualization ZIP File
- Custom Visualization Files
- Installing Custom Visualization Extensions
We have edited the src/config/wizardConfig.ts file to design the configuration wizard for our custom visualization. As you will be able to see in the code below, these are some of the things we have created:
– different types of fields: string, number, color, dropdown, attribute picker (a way to select an attribute from a data set), boolean (toggle switch)
– a group of fields
– a series-type configuration
This is what this file looks like:
/*
* wizardConfig.ts
*
* Copyright © 2020 Edge Technologies Inc.
*/
/*
* wizardConfig.ts
*/
import {
IEdgeCustomWizard,
IEdgeWidgetWizardConfig,
IEdgeWidgetConfigWizardFactory,
CustomWidgetRegistrar,
EdgeWizardFieldDefBuilder,
EdgeWizardFieldGroup,
DataAttributeType,
EdgeWizardFieldGroupBuilder,
EdgeWidgetStepConfigBuilder,
} from "@edge_technologies/custom-widget-api";
declare var edge: any;
export class ConfigWizardFactory implements IEdgeWidgetConfigWizardFactory {
createWidgetConfigWizard(config: any, wizard: IEdgeCustomWizard): IEdgeWidgetWizardConfig {
const FieldDef = EdgeWizardFieldDefBuilder;
let secondaryYAxisShowLabels = false;
let secondaryYAxisStaticStart = false;
let secondaryYAxisStaticEnd = false;
const cfg: IEdgeWidgetWizardConfig = {
steps: [
{
// The ID of the Wizard step, must be unique
id: 'Chart Configuration',
label: 'General',
fields: [
new EdgeWizardFieldGroup(
'Base Chart Configuration',
[
[
FieldDef.string('chartTitle', 'Chart Title').build()
], [
FieldDef.color('chartTitleColor', 'Chart Title Color').build()
], [
FieldDef.boolean('showAnimations', 'Show Animations?').defaultValue(true)
.onChange((newValue) => {
wizard.setFieldVisible('animationTime', !!newValue);
}).build()
], [
FieldDef.number('animationTime', 'Animation Time').visible(false).defaultValue(100).build()
], [
FieldDef.boolean('showLegend', 'Show Legend?').defaultValue(true)
.onChange((newValue) => {
wizard.setFieldVisible('legendPosition', !!newValue);
wizard.setFieldVisible('legendAlignment', !!newValue);
wizard.setFieldVisible('legendDirection', !!newValue);
}).build()
], [
FieldDef.dropdown('legendPosition', 'Legend Position')
.choices([
{ label: 'top', value: 'top' },
{ label: 'middle', value: 'middle' },
{ label: 'bottom', value: 'bottom' }
]).defaultValue('bottom').visible(false).build(),
FieldDef.dropdown('legendAlignment', 'Legend Alignment')
.choices([
{ label: 'left', value: 'left' },
{ label: 'center', value: 'center' },
{ label: 'right', value: 'right' }
]).defaultValue('center').visible(false).build(),
FieldDef.dropdown('legendDirection', 'Legend Direction')
.choices([
{ label: 'horizontal', value: 'horizontal' },
{ label: 'vertical', value: 'vertical' },
{ label: 'proximate', value: 'proximate' }
]).defaultValue('horizontal').visible(false).build()
]
]
)
],
visible: true
}, {
id: 'X Axis',
label: 'X Axis',
fields: [
new EdgeWizardFieldGroup(
'X Axis',
[
[
FieldDef.attributePicker('categoryAttribute', 'X Axis Data Column').required(true).build(),
FieldDef.string("xAxisTitle", "X Axis Title").defaultValue('').build()
],[
FieldDef.number('xAxisTickInterval', 'Tick Interval').defaultValue(1).build()
],[
FieldDef.boolean('xAxisLabelFixedAngle', 'Label Angle Fixed?')
.onChange((newValue) => {
wizard.setFieldVisible('xAxisLabelAngle', !!newValue);
})
.defaultValue(false).build(),
FieldDef.number('xAxisLabelAngle', 'Fixed Angle').defaultValue(-90).visible(false).build()
]
]
),
new EdgeWizardFieldGroup(
'X Axis Grouping',
[
[
FieldDef.boolean('enableGrouping', 'Enable Grouping')
.onChange((newValue) => {
wizard.setFieldVisible('groupingAttribute', !!newValue);
wizard.setFieldVisible('alternatePlotBandColor', !!newValue);
wizard.setFieldVisible('plotBandLabelColor', !!newValue);
wizard.setFieldVisible('plotBandLabelAlignment', !!newValue);
})
.defaultValue(false).build()
], [
FieldDef.attributePicker('groupingAttribute', 'Grouping Data Column').visible(false).required(true).build()
], [
FieldDef.color('alternatePlotBandColor', 'Alternate Grouping Color').visible(false).defaultValue('default-6').build()
], [
FieldDef.color('plotBandLabelColor', 'Grouping Label Color').visible(false).defaultValue('greyscale-4').build()
], [
FieldDef.dropdown('plotBandLabelAlignment', 'Label Alignment').choices([
{ label: 'left', value: 'left' },
{ label: 'center', value: 'center' },
{ label: 'right', value: 'right' }
]).defaultValue('left').visible(false).build()
]
]
)
],
// Initialize the step to be visible on launch
visible: true
},
{
// The ID of the Wizard step, must be unique
id: 'Y Axis',
label: 'Y Axis',
fields: [
new EdgeWizardFieldGroup(
'Primary Y Axis',
[
[
FieldDef.string('primaryYAxisTitle', 'Primary Y Axis Title').build(),
FieldDef.color('primaryYAxisColor', 'Axis and Label Color').build()
], [
FieldDef.boolean('primaryYAxisStaticStart', 'Static Start Value?')
.onChange((newValue) => {
wizard.setFieldVisible('primaryYAxisStart', !!newValue);
})
.defaultValue(false).build(),
FieldDef.number('primaryYAxisStart', 'Starting Value').visible(false).build()
], [
FieldDef.boolean('primaryYAxisStaticEnd', 'Static End Value?')
.onChange((newValue) => {
wizard.setFieldVisible('primaryYAxisEnd', !!newValue);
})
.defaultValue(false).build(),
FieldDef.number('primaryYAxisEnd', 'Ending Value').visible(false).build()
], [
FieldDef.boolean("primaryYAxisShowLabels", "Show Value Labels?")
.onChange((newValue) => {
wizard.setFieldVisible('primaryYAxisLabelSuffix', !!newValue);
wizard.setFieldVisible('primaryYAxisAllowDecimals', !!newValue);
})
.defaultValue(true).build(),
// ], [
FieldDef.string('primaryYAxisLabelSuffix', 'Label Suffix').visible(false).defaultValue('').build(),
FieldDef.boolean('primaryYAxisAllowDecimals', 'Allow Decimals?').visible(false).defaultValue(true).build()
]
]
),
new EdgeWizardFieldGroup(
'Secondary Y Axis',
[
[
FieldDef.boolean("enableSecondayYAxis", "Endable Secondary Y Axis").defaultValue(false)
.onChange((newValue) => {
wizard.setFieldVisible('secondaryYAxisTitle', !!newValue);
wizard.setFieldVisible('secondaryYAxisColor', !!newValue);
wizard.setFieldVisible('secondaryYAxisStaticStart', !!newValue);
wizard.setFieldVisible('secondaryYAxisStart', !!newValue && secondaryYAxisStaticStart);
wizard.setFieldVisible('secondaryYAxisStaticEnd', !!newValue);
wizard.setFieldVisible('secondaryYAxisEnd', !!newValue && secondaryYAxisStaticEnd);
wizard.setFieldVisible('secondaryYAxisShowLabels', !!newValue);
wizard.setFieldVisible('secondaryYAxisLabelSuffix', !!newValue && secondaryYAxisShowLabels);
wizard.setFieldVisible('secondaryYAxisAllowDecimals', !!newValue && secondaryYAxisShowLabels);
}).build()
], [
FieldDef.string('secondaryYAxisTitle', 'Secondary Y Axis Title').visible(false).build(),
FieldDef.color('secondaryYAxisColor', 'Axis and Label Color').visible(false).build()
], [
FieldDef.boolean('secondaryYAxisStaticStart', 'Static Start Value?')
.onChange((newValue) => {
secondaryYAxisStaticStart = !!newValue;
wizard.setFieldVisible('secondaryYAxisStart', !!newValue);
})
.defaultValue(false).build(),
FieldDef.number('secondaryYAxisStart', 'Starting Value').visible(false).build(),
], [
FieldDef.boolean('secondaryYAxisStaticEnd', 'Static End Value?')
.onChange((newValue) => {
secondaryYAxisStaticEnd = !!newValue;
wizard.setFieldVisible('secondaryYAxisEnd', !!newValue);
})
.defaultValue(false).build(),
FieldDef.number('secondaryYAxisEnd', 'Ending Value').visible(false).build()
], [
FieldDef.boolean('secondaryYAxisShowLabels', 'Show Labels?')
.onChange((newValue) => {
secondaryYAxisShowLabels = !!newValue;
wizard.setFieldVisible('secondaryYAxisLabelSuffix', !!newValue);
wizard.setFieldVisible('secondaryYAxisAllowDecimals', !!newValue);
}).defaultValue(false).visible(false).build()
], [
FieldDef.string('secondaryYAxisLabelSuffix', 'Label Suffix').visible(false).defaultValue('').build(),
FieldDef.boolean('secondaryYAxisAllowDecimals', 'Allow Decimals?').defaultValue(false).visible(false).build()
]
]
)
],
visible: true
},
EdgeWidgetStepConfigBuilder.create('seriesConfig', 'Data Series')
.fields([
EdgeWizardFieldGroupBuilder.create('dataSeries')
.isSeries(true, 'Chart')
.fields(
[
[
FieldDef.attributePicker('seriesAttribute', 'Data Column (numeric)')
.restrictType(DataAttributeType.NUMBER).required(true).build(),
],[
FieldDef.string('seriesLabel', 'Label').required(true).build(),
],[
FieldDef.color('seriesColor', 'Color').build(),
FieldDef.number('seriesBorderWidth', 'Border Width').min(1).max(10).defaultValue(2).build(),
FieldDef.number('seriesAlpha', 'Opacity').min(0).max(1).step(0.1).defaultValue(0.7).build()
],[
FieldDef.dropdown('seriesYAxis', 'Y Axis').choices([
{ label: 'primary', value: 0 },
{ label: 'secondary', value: 1 }
]).defaultValue(0).visible(true).build()
],[
FieldDef.dropdown('seriesChartType', 'Chart Type').choices([
{ label: 'line', value: 'line' },
{ label: 'column', value: 'column' },
{ label: 'area', value: 'area' },
{ label: 'spline', value: 'spline' },
{ label: 'areaspline', value: 'areaspline' }
]).defaultValue('line').visible(true).build()
],[
FieldDef.boolean('seriesStaticSize', 'Set Static Line/Bar Width?')
.onChange((newValue) => {
wizard.setFieldVisible('seriesSize', !!newValue);
}).defaultValue(false).build(),
FieldDef.number('seriesSize', 'Width').defaultValue(15).visible(false).build()
]
])
.build()
])
.build()
]
};
return cfg;
}
}
CustomWidgetRegistrar.configWizardFactory('dualAxisChart', new ConfigWizardFactory());
Having done that, we have made changes to src/widget/widget.ts which serves as the main entry for our custom visualization implementation.
/*
 * widget.ts
 *
 * Copyright © 2020 Edge Technologies Inc.
 */

import {IEdgeWidgetContext, CustomWidgetRegistrar} from "@edge_technologies/custom-widget-api";
import './myStyles.scss';
import * as Highcharts from 'highcharts';

declare var edge: any;
declare var $:JQueryStatic;
class WidgetFactory {
    createWidgetInstance(domElement: HTMLElement, context: any): void {
        const widget = new CustomWidget(domElement, context);
    }
}
CustomWidgetRegistrar.widgetFactory('dualAxisChart', new WidgetFactory());

class CustomWidget {
    chart: Highcharts.Chart;

    oldPlotBandIds:string[] = [];
    valueSets:any[] = [];

    private _isDarkTheme: boolean;
    get isDarkTheme(): boolean{
        if (this._isDarkTheme === undefined) {
            this._isDarkTheme = false;
            $('head>link').each((index, item: HTMLLinkElement) => {
                if (item.href && item.href.indexOf('SlateTheme.css') !== -1) {
                    this._isDarkTheme = true;
                }
            });
        }
        return this._isDarkTheme;
    }

    hexToRGB = function(h:string) {
        let r:number = 0, g:number = 0, b:number = 0;
        if (h.length == 4) {
            r = parseInt( h[1] + h[1], 16);
            g = parseInt( h[2] + h[2], 16);
            b = parseInt( h[3] + h[3], 16);
        } else if (h.length == 7) {
            r = parseInt( h[1] + h[2], 16);
            g = parseInt( h[3] + h[4], 16);
            b = parseInt( h[5] + h[6], 16);
        }
        return [r, g, b];
    };

    rowData:any[] = []; // an ordered list of row data for use with event handling
    eventHandler( e:any ){
        if( e.type == 'click' ) {
            this.context.fireRowClickEvent( this.rowData[ e.point.index ]);
        } else if ( e.type == 'mouseOver' ) {
            this.context.fireRowHoverEvent( this.rowData[ e.target.index ]);
        } else if ( e.type == 'mouseOut' ) {
            this.context.fireRowHoverEvent( undefined );
        }
    }

    constructor(public domElement: HTMLElement, public context: IEdgeWidgetContext) {
        this.init();
        // console.log( 'CONFIG:  ' + JSON.stringify(this.context.config ));
        const dataSeriesConfig:any[] = this.context.seriesConfig('dataSeries');


        context.onDestroy = () => {
            if (this.chart) {
                this.chart.destroy();
            }
            $(this.domElement).empty();
        };

        // set up data handling
        context.dataChanged = rows => {
            this.valueSets = [];
            let categories:string[] = [];

            // building groupings / order
            let groupings:string[] = [];
            let data:{[key:string]:any} = {};
            let rowIdx:number = 0;

            this.rowData = [];
            rows.forEach( row => {
                if( this.context.config.enableGrouping ) {
                    // set up some grouping info
                    let grp:string = row[ this.context.config.groupingAttribute ];
                    if( ! groupings.includes( grp ) ){
                        groupings.push( grp );
                        data[ grp ] = [];
                    }
                    data[ grp ].push({  // this set of items in the group in subgroup order but storing original placement index
                        grp: grp,
                        cat: row[ this.context.config.categoryAttribute ],
                        idx: rowIdx
                    });
                } else {
                    // build non-grouped data for chart series
                    categories.push( row[ this.context.config.categoryAttribute ] );
                    for( var i=0; i < dataSeriesConfig.length; i++) {
                        if ( this.valueSets[i] === undefined ) { this.valueSets[i] = []; };
                        this.valueSets[i].push( row[ dataSeriesConfig[i].seriesAttribute ] );
                    }
                    this.rowData.push( row ); // add data to ordered row list for event handling
                }
                rowIdx++;
            });

            if( this.context.config.enableGrouping ) {
                // set up everything else related to grouping

                // remove plotbands if existing
                this.oldPlotBandIds.forEach( id =>{
                    this.chart.xAxis[0].removePlotBand( id );
                });
                this.oldPlotBandIds = [];

                // create new grouping and plotbands
                let isOdd:boolean = false;
                let itemIdx:number = 0;
                let fromIdx:number = 0;
                groupings.forEach( grp => {

                    // this is a loop over the datapoints in each grouping
                    // it makes an expanded list of categories for the x axis
                    // and provides start/stop counts for banding
                    fromIdx = itemIdx;
                    data[ grp ].forEach(  (item:any) => {
                        categories.push( item.cat );
                        for( var i=0; i < dataSeriesConfig.length; i++) {  // this builds value arrays in the group sort order
                            if ( this.valueSets[i] === undefined ) { this.valueSets[i] = []; };
                            this.valueSets[i][ itemIdx ] = rows[ item.idx ][ dataSeriesConfig[i].seriesAttribute ];
                        }
                        this.rowData.push( rows[ item.idx ] ); // add data to ordered row list for event handling
                        itemIdx++;
                    });

                    const bgcolor = this.isDarkTheme ? '#000' : '#fff';
                    this.chart.xAxis[0].addPlotBand( {
                        id: 'pb-' + itemIdx + grp,
                        color: isOdd ? bgcolor : this.context.getColor('alternatePlotBandColor', true).color,
                        from: fromIdx - 0.5,
                        to: itemIdx + 0.5,
                        label: {
                            style: {
                                color: this.context.getColor('plotBandLabelColor',true).color
                            },
                            text: grp,
                            align: this.context.config.plotBandLabelAlignment,
                            x: 5,
                            y: 15
                        },
                    });
                    this.oldPlotBandIds.push( 'pb-' + itemIdx + grp );
                    isOdd = ! isOdd;
                });
            }


            // refresh the chart data without redraw
            this.chart.xAxis[0].setCategories( categories, false );
            for( var i=0; i < dataSeriesConfig.length; i++) {
                this.chart.series[i].setData( this.valueSets[i], false, null, false );
            };
            this.chart.redraw();
        };

        // handle resizing
        context.widgetResized = size => {
            if ( this.chart ){ this.chart.reflow(); }
        };
    }

    init(): void {
        const colors = this.isDarkTheme ? {
            labelColor: '#606060',
            lineColor: '#222'
        } : {
            labelColor: '#999',
            lineColor: '#aaa'
        }

        const edgeShapeChart = $('<edge-shape-chart></edge-shape-chart>');
        $(this.domElement).append(edgeShapeChart);
        this.chart = Highcharts.chart(edgeShapeChart[0], {
            title: {
                text: this.context.config.chartTitle,
                style: {
                    color: this.context.getColor( 'chartTitleColor' ).color
                }
            },
            tooltip: { enabled: false },
            chart: {
                animation: this.context.config.showAnimations ? {duration: this.context.config.animationTime} : false,
                type: 'xy',
                backgroundColor: 'transparent',
                spacing: [5, 5, 5, 5]
            },
            plotOptions: {
                series: {
                    point: {
                        events: {
                            click: this.eventHandler.bind(this), // bind this to get the context right
                            mouseOver: this.eventHandler.bind(this),
                        }
                    },
                    events: {
                        mouseOut: this.eventHandler.bind(this)
                    }
                }
            },
            xAxis: [{
                gridLineColor: colors.lineColor,
                lineColor: colors.lineColor,
                tickColor: colors.lineColor,
                type: 'category',
                title: {
                    style: { color: colors.labelColor },
                    text: this.context.config.xAxisTitle
                },
                labels: {
                    style: { color: colors.labelColor },
                    rotation: this.context.config.xAxisLabelFixedAngle ? this.context.config.xAxisLableAngle : undefined
                },
                tickInterval: this.context.config.xAxisTickInterval
            }],
            yAxis: [{ // Primary yAxis
                title: {
                    text: this.context.config.primaryYAxisTitle,
                    style: {
                        color: this.context.getColor('primaryYAxisColor',true).color
                    }
                },
                labels: {
                    enabled: this.context.config.primaryYAxisShowLabels,
                    format: '{value}' + this.context.config.primaryYAxisLabelSuffix,
                    style: {
                        color: this.context.getColor('primaryYAxisColor',true).color
                    }
                },
                gridLineColor: colors.lineColor,
                lineColor: colors.lineColor,
                tickColor: colors.lineColor,
                allowDecimals: this.context.config.primaryYAxisAllowDecimals,
                min: this.context.config.primaryYAxisStaticStart ? this.context.config.primaryYAxisStart : null,
                max: this.context.config.primaryYAxisStaticEnd ? this.context.config.primaryYAxisEnd : null
            }, { // Secondary yAxis
                title: {
                    text: this.context.config.secondaryYAxisTitle,
                    style: {
                        color: this.context.getColor('secondaryYAxisColor',true).color
                    }
                },
                labels: {
                    enabled: this.context.config.secondaryYAxisShowLabels,
                    format: '{value}' + this.context.config.secondaryYAxisLabelSuffix,
                    style: {
                        color: this.context.getColor('secondaryYAxisColor',true).color
                    }
                },
                gridLineColor: colors.lineColor,
                lineColor: colors.lineColor,
                tickColor: colors.lineColor,
                allowDecimals: this.context.config.secondaryYAxisAllowDecimals,
                opposite: true,
                min: this.context.config.secondaryYAxisStaticStart ? this.context.config.secondaryYAxisStart : null,
                max: this.context.config.secondaryYAxisStaticEnd ? this.context.config.secondaryYAxisEnd : null
            }],
            legend:      {
                enabled: this.context.config.showLegend,
                itemStyle: {
                    lineHeight: '10px',
                    fontSize: '10px'
                },
                itemDistance: 10,
                padding: 0,
                itemMarginTop: 0,
                itemMarginBottom: 0,
                symbolPadding: 5,
                align:  this.context.config.legendAlignment,
                layout:  this.context.config.legendDirection,
                verticalAlign:  this.context.config.legendPosition
            },
            credits: { enabled: false }
        });
        const dataSeriesConfig = this.context.seriesConfig('dataSeries');
        dataSeriesConfig.forEach( (sc:any) => {
            let c = this.hexToRGB( sc.getColor('seriesColor').color );
            this.chart.addSeries({
                name: sc.seriesLabel,
                type: sc.seriesChartType,
                color: 'rgb(' + c[0] + ',' + c[1] + ',' + c[2] + ',' + sc.seriesAlpha + ')',
                yAxis: sc.seriesYAxis,
                pointWidth: sc.StaticSize ? sc.seriesSize : undefined,
                lineWidth: sc.seriesSize,
                borderColor: sc.getColor('seriesColor', true).color,
                borderWidth: sc.seriesBorderWidth,
                marker: { enabled: false },
                animation: this.context.config.showAnimations ? {duration: this.context.config.animationTime} : false
            })
        });
    }
}
After running a build and generating the extension zip (npm run build) and uploading it into edge, our configuration has resulted in the following:
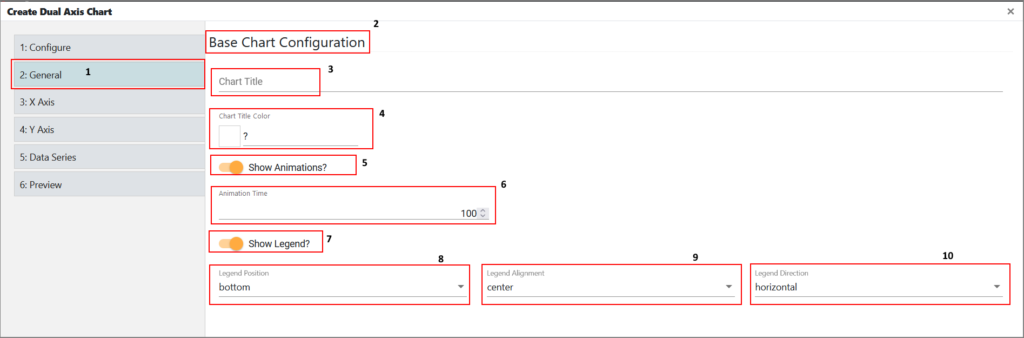
Where 1 reflects the following from the wizardConfig.ts file:
const cfg: IEdgeWidgetWizardConfig = {
            steps: [
                {
                    // The ID of the Wizard step, must be unique
                    id: 'Chart Configuration',
                    label: 'General',
                    fields: [
2 reflects the following:
fields: [
        new EdgeWizardFieldGroup(
        'Base Chart Configuration',
        [
3 reflects the following:
[
      FieldDef.string('chartTitle', 'Chart Title').build()
   ], [
4 reflects the following:
], [
   FieldDef.color('chartTitleColor', 'Chart Title Color').build()
], [
5 reflects the following:
], [
    FieldDef.boolean('showAnimations', 'Show Animations?').defaultValue(true)
         .onChange((newValue) => {
             wizard.setFieldVisible('animationTime', !!newValue);
         }).build()
], [
6 reflects the following:
], [
    FieldDef.number('animationTime', 'Animation Time').visible(false).defaultValue(100).build()
], [
7 reflects the following:
], [
     FieldDef.boolean('showLegend', 'Show Legend?').defaultValue(true)
          .onChange((newValue) => {
              wizard.setFieldVisible('legendPosition', !!newValue);
              wizard.setFieldVisible('legendAlignment', !!newValue);
              wizard.setFieldVisible('legendDirection', !!newValue);
           }).build()
], [
8, 9, and 10 reflect the following:
], [
                                    FieldDef.dropdown('legendPosition', 'Legend Position')
                                        .choices([
                                            { label: 'top', value: 'top' },
                                            { label: 'middle', value: 'middle' },
                                            { label: 'bottom', value: 'bottom' }
                                        ]).defaultValue('bottom').visible(false).build(),
                                    FieldDef.dropdown('legendAlignment', 'Legend Alignment')
                                        .choices([
                                            { label: 'left', value: 'left' },
                                            { label: 'center', value: 'center' },
                                            { label: 'right', value: 'right' }
                                        ]).defaultValue('center').visible(false).build(),
                                    FieldDef.dropdown('legendDirection', 'Legend Direction')
                                        .choices([
                                            { label: 'horizontal', value: 'horizontal' },
                                            { label: 'vertical', value: 'vertical' },
                                            { label: 'proximate', value: 'proximate' }
                                        ]).defaultValue('horizontal').visible(false).build()
                                ]
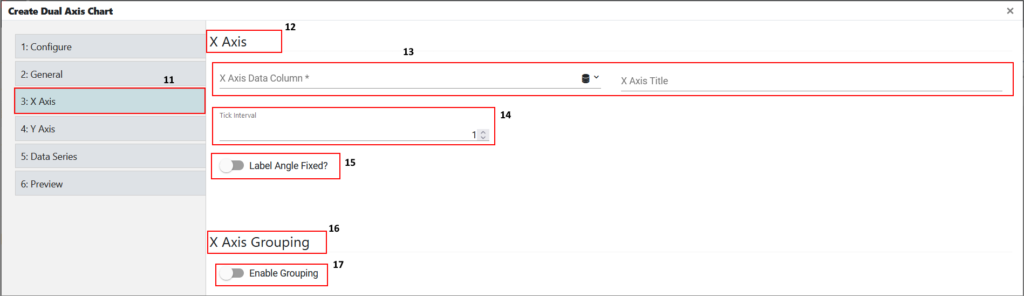
11 reflects the following:
{
                    id: 'X Axis',
                    label: 'X Axis',
                    fields: [
12 reflects the following:
fields: [
                        new EdgeWizardFieldGroup(
                            'X Axis',
                            [
13 reflects the following:
[
                                [
                                    FieldDef.attributePicker('categoryAttribute', 'X Axis Data Column').required(true).build(),
                                    FieldDef.string("xAxisTitle", "X Axis Title").defaultValue('').build()
                                ],[
14 reflects the following:
],[
                                    FieldDef.number('xAxisTickInterval', 'Tick Interval').defaultValue(1).build()
                                ],[
15 reflects the following:
],[
                                    FieldDef.boolean('xAxisLabelFixedAngle', 'Label Angle Fixed?')
                                        .onChange((newValue) => {
                                            wizard.setFieldVisible('xAxisLabelAngle', !!newValue);
                                        })
                                        .defaultValue(false).build(),
                                    FieldDef.number('xAxisLabelAngle', 'Fixed Angle').defaultValue(-90).visible(false).build()
                                ]
16 reflects the following:
 ),
                        new EdgeWizardFieldGroup(
                            'X Axis Grouping',
                            [
17 reflects the following:
 [
                                    FieldDef.boolean('enableGrouping', 'Enable Grouping')
                                        .onChange((newValue) => {
                                            wizard.setFieldVisible('groupingAttribute', !!newValue);
                                            wizard.setFieldVisible('alternatePlotBandColor', !!newValue);
                                            wizard.setFieldVisible('plotBandLabelColor', !!newValue);
                                            wizard.setFieldVisible('plotBandLabelAlignment', !!newValue);
                                        })
                                        .defaultValue(false).build()
                                ], [
                                    FieldDef.attributePicker('groupingAttribute', 'Grouping Data Column').visible(false).required(true).build()
                                ], [
                                    FieldDef.color('alternatePlotBandColor', 'Alternate Grouping Color').visible(false).defaultValue('default-6').build()
                                ], [
                                    FieldDef.color('plotBandLabelColor', 'Grouping Label Color').visible(false).defaultValue('greyscale-4').build()
                                ], [
                                    FieldDef.dropdown('plotBandLabelAlignment', 'Label Alignment').choices([
                                        { label: 'left', value: 'left' },
                                        { label: 'center', value: 'center' },
                                        { label: 'right', value: 'right' }
                                    ]).defaultValue('left').visible(false).build()
                                ]
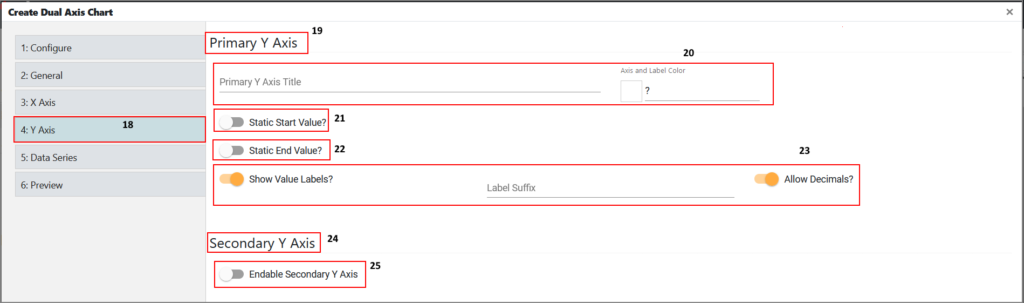
18 reflects the following:
{
                    // The ID of the Wizard step, must be unique
                    id: 'Y Axis',
                    label: 'Y Axis',
                    fields: [
19 reflects the following:
fields: [
                        new EdgeWizardFieldGroup(
                            'Primary Y Axis',
                            [
20 reflects the following:
[
                                    FieldDef.string('primaryYAxisTitle', 'Primary Y Axis Title').build(),
                                    FieldDef.color('primaryYAxisColor', 'Axis and Label Color').build()
                                ], [
21 reflects the following:
], [
                                    FieldDef.boolean('primaryYAxisStaticStart', 'Static Start Value?')
                                        .onChange((newValue) => {
                                            wizard.setFieldVisible('primaryYAxisStart', !!newValue);
                                        })
                                        .defaultValue(false).build(),
                                    FieldDef.number('primaryYAxisStart', 'Starting Value').visible(false).build()
                                ], [
22 reflects the following:
], [
                                    FieldDef.boolean('primaryYAxisStaticEnd', 'Static End Value?')
                                        .onChange((newValue) => {
                                            wizard.setFieldVisible('primaryYAxisEnd', !!newValue);
                                        })
                                        .defaultValue(false).build(),
                                    FieldDef.number('primaryYAxisEnd', 'Ending Value').visible(false).build()
                                ], [
23 reflects the following:
], [
                                    FieldDef.boolean("primaryYAxisShowLabels", "Show Value Labels?")
                                        .onChange((newValue) => {
                                            wizard.setFieldVisible('primaryYAxisLabelSuffix', !!newValue);
                                            wizard.setFieldVisible('primaryYAxisAllowDecimals', !!newValue);
                                        })
                                        .defaultValue(true).build(),
                                // ], [
                                    FieldDef.string('primaryYAxisLabelSuffix', 'Label Suffix').visible(false).defaultValue('').build(),
                                    FieldDef.boolean('primaryYAxisAllowDecimals', 'Allow Decimals?').visible(false).defaultValue(true).build()
                                ]
24 reflects the following:
),
                        new EdgeWizardFieldGroup(
                            'Secondary Y Axis',
                            [
25 reflects the following:
[
                                    FieldDef.boolean("enableSecondayYAxis", "Endable Secondary Y Axis").defaultValue(false)
                                        .onChange((newValue) => {
                                            wizard.setFieldVisible('secondaryYAxisTitle', !!newValue);
                                            wizard.setFieldVisible('secondaryYAxisColor', !!newValue);
                                            wizard.setFieldVisible('secondaryYAxisStaticStart', !!newValue);
                                            wizard.setFieldVisible('secondaryYAxisStart', !!newValue && secondaryYAxisStaticStart);
                                            wizard.setFieldVisible('secondaryYAxisStaticEnd', !!newValue);
                                            wizard.setFieldVisible('secondaryYAxisEnd', !!newValue && secondaryYAxisStaticEnd);
                                            wizard.setFieldVisible('secondaryYAxisShowLabels', !!newValue);
                                            wizard.setFieldVisible('secondaryYAxisLabelSuffix', !!newValue && secondaryYAxisShowLabels);
                                            wizard.setFieldVisible('secondaryYAxisAllowDecimals', !!newValue && secondaryYAxisShowLabels);
                                        }).build()
                                ], [
                                    FieldDef.string('secondaryYAxisTitle', 'Secondary Y Axis Title').visible(false).build(),
                                    FieldDef.color('secondaryYAxisColor', 'Axis and Label Color').visible(false).build()
                                ], [
                                    FieldDef.boolean('secondaryYAxisStaticStart', 'Static Start Value?')
                                        .onChange((newValue) => {
                                            secondaryYAxisStaticStart = !!newValue;
                                            wizard.setFieldVisible('secondaryYAxisStart', !!newValue);
                                        })
                                        .defaultValue(false).build(),
                                    FieldDef.number('secondaryYAxisStart', 'Starting Value').visible(false).build(),
                                ], [
                                    FieldDef.boolean('secondaryYAxisStaticEnd', 'Static End Value?')
                                        .onChange((newValue) => {
                                            secondaryYAxisStaticEnd = !!newValue;
                                            wizard.setFieldVisible('secondaryYAxisEnd', !!newValue);
                                        })
                                        .defaultValue(false).build(),
                                    FieldDef.number('secondaryYAxisEnd', 'Ending Value').visible(false).build()
                                ], [
                                    FieldDef.boolean('secondaryYAxisShowLabels', 'Show Labels?')
                                        .onChange((newValue) => {
                                            secondaryYAxisShowLabels = !!newValue;
                                            wizard.setFieldVisible('secondaryYAxisLabelSuffix', !!newValue);
                                            wizard.setFieldVisible('secondaryYAxisAllowDecimals', !!newValue);
                                        }).defaultValue(false).visible(false).build()
                                ], [
                                    FieldDef.string('secondaryYAxisLabelSuffix', 'Label Suffix').visible(false).defaultValue('').build(),
                                    FieldDef.boolean('secondaryYAxisAllowDecimals', 'Allow Decimals?').defaultValue(false).visible(false).build()
                                ]
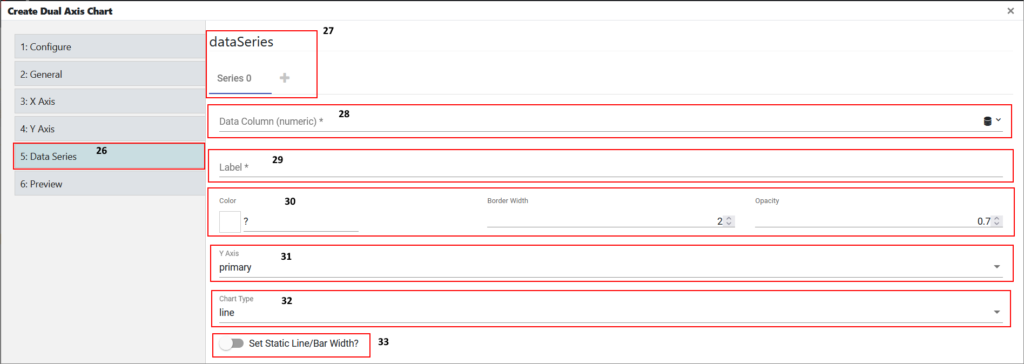
26 reflects the following:
},
                EdgeWidgetStepConfigBuilder.create('seriesConfig', 'Data Series')
                    .fields([
27 reflects the following:
.fields([
                        EdgeWizardFieldGroupBuilder.create('dataSeries')
                            .isSeries(true, 'Chart')
                            .fields(
28 reflects the following:
[
                                        FieldDef.attributePicker('seriesAttribute', 'Data Column (numeric)')
                                            .restrictType(DataAttributeType.NUMBER).required(true).build(),
                                    ],[
29 reflects the following:
],[
                                        FieldDef.string('seriesLabel', 'Label').required(true).build(),
                                    ],[
30 reflects the following:
],[
                                        FieldDef.color('seriesColor', 'Color').build(),
                                        FieldDef.number('seriesBorderWidth', 'Border Width').min(1).max(10).defaultValue(2).build(),
                                        FieldDef.number('seriesAlpha', 'Opacity').min(0).max(1).step(0.1).defaultValue(0.7).build()
                                    ],[
31 reflects the following:
],[
                                        FieldDef.dropdown('seriesYAxis', 'Y Axis').choices([
                                            { label: 'primary', value: 0 },
                                            { label: 'secondary', value: 1 }
                                        ]).defaultValue(0).visible(true).build()
                                    ],[
32 reflects the following:
],[
                                        FieldDef.dropdown('seriesChartType', 'Chart Type').choices([
                                            { label: 'line', value: 'line' },
                                            { label: 'column', value: 'column' },
                                            { label: 'area', value: 'area' },
                                            { label: 'spline', value: 'spline' },
                                            { label: 'areaspline', value: 'areaspline' }
                                        ]).defaultValue('line').visible(true).build()
                                    ],[
33 reflects the following:
],[
                                        FieldDef.boolean('seriesStaticSize', 'Set Static Line/Bar Width?')
                                            .onChange((newValue) => {
                                                wizard.setFieldVisible('seriesSize', !!newValue);
                                            }).defaultValue(false).build(),
                                        FieldDef.number('seriesSize', 'Width').defaultValue(15).visible(false).build()
                                    ]