![]()
A Flow Relational Model is a specialized transform that produces a data structure that can be visualized using a Flow Diagram. The important concept behind a Flow Relational Model is that it builds up a hierarchical dataset based on link information. This differs from a TreeMap Relational model, which builds its model from node information.
Create a Flow Relational Model Transform
- Select the
 icon for a node
 - Select the “Transform” option from the context menu.

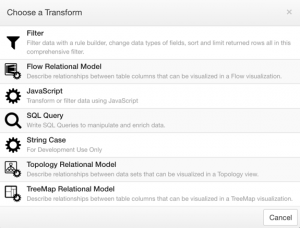
The “Choose a Transform” dialog will appear, showing the available transforms in the system.
- Select the “Flow Relational Model” option. This will launch the Flow Relational Model Wizard:

Flow Relational Model Wizard
Step 1: Configure

| Property | Description |
|---|---|
| Name | A symbolic name used to represent this transform. This is the name that will show up the in the pipeline node representing this transform. |
| Description | This is where the administrator can enter notes for the transform. |
Step 2: Columns
This step sets up the relationship between attributes in the underlying dataset.

| Property | Description |
|---|---|
| Column | This list of attributes defines the relationship to be displayed inside of corresponding Sankey and Chord Diagrams. These attributes defined here will show up as: – Columns within the Sankey visualization – Separate Groups on the outside of a chord diagram. The unique values for each attribute will show up as: – Nodes within a the individual columns inside a Sankey visualization – Nodes on around the outer perimeter of a Chord diagram. If you were looking as Stock Market data (see example below), you may want to see Summations of stock prices by “Sector”, and how those sectors feed “Industry”, and ultimately how the different Industries affect the various “Markets”. The order can be adjusted by dragging list items to new positions within the list. The size of the nodes will be calculated based on the Link Value Aggregation method selected. See “Link Value Aggregation” below. |
| Link Value Aggregation |
This property determines how to calculate the proportional sizes of the nodes inside of a Sankey or a Chord Diagram. The visualizations for a Flow Relational Model will group the data by each specified attribute, and then generate a proportional size based on the aggregation function specified here. There are several different options for calculating sizes:
|
Sample Stock Data
| Name | Market | Sector | Industry | Price | |
|---|---|---|---|---|---|
| APPL | Apple Inc. | Nasdaq | Information Technology | Technology Hardware & Equipment | 113.00 |
| AMZN | Amazon.com, Inc. | Nasdaq | Consumer Discretionary | Retailing | 759.62 |
| GOOG | Alphabet Inc Class A | Nasdaq | Information Technology | Software & Services | 807.22 |
| MCD | McDonald’s Corporation | Nasdaq | Consumer Discretionary | Consumer Services | 121.57 |
| … | |||||
| BRK/A | Berkshire Hathaway Inc. | NYSE | Financials | Diversified Financials | 249,290.00 |
| TWX | Time Warner Inc. | NYSE | Consumer Discretionary | Media | 94.71 |
| VZ | Verizon Communications Inc. | NYSE | Telecommunication Services | Telecommunication Services | 51.90 |
| PEP | PepsiCo Inc. | NYSE | Consumer Staples | Food Beverage & Tobacco | 104.31 |
Step 3: Upstream Variables
Details about this step can found here: Satisfy Upstream Node Variables Wizard Step.
Step 4: Preview
Refer to the Variables section for more information.
