Here you will do the following:
- Add a background image to a Visualization
- Create custom formatting for presenting data
- Show multiple data attributes and values in one Visualization
You will begin this exercise by loading two data elements in the edgeCore file system. The first is a CSV file with information about all of the national parks in the US. The second is a background image file associated with each park.
Next, you will create a List Visualization that displays the name of each park and the state where it is located. Finally, you will create an HTML Template Visualization that will display several data values and a background image for a selected state.
Copy Files to Server
Perform the following steps to load the National Parks data elements and images in the edgeCore file system:
- Download the National_Parks and Parks folders and unzip them.
- Copy the National_Parks folder into edgeCore’s data folder:
[Install_Home]/data/National_Parks/ - Confirm that the following file is located in the folder:
[Install_Home]/data/National_Parks/NationalParkSummary.csv - Copy the Parks folder into edgeCore’s static-web folder:
[Install_Home]/static-web/Parks/ - Confirm that there are several JPG image files located in the folder:
[Install_Home]/static-web/Parks/Acadia.jpg
[Install_Home]/static-web/Parks/Arches.jpg
… and so on
Create a List Visualization
In this step, you will create a List Visualization that displays the name of each park and the state where it is located.
- Create a new connection (Connection Type: File / Server Filesystem).
– Server Path should be data/National_Parks because the file is located in edgeCore’s data folder; - Off of the newly created connection, create a CSV feed.
– In Feed Name, provide a name (for example, National Park Summary).
– In File Name, select National Park Summary.csv ; - Off of the newly created feed, create a List visualization.
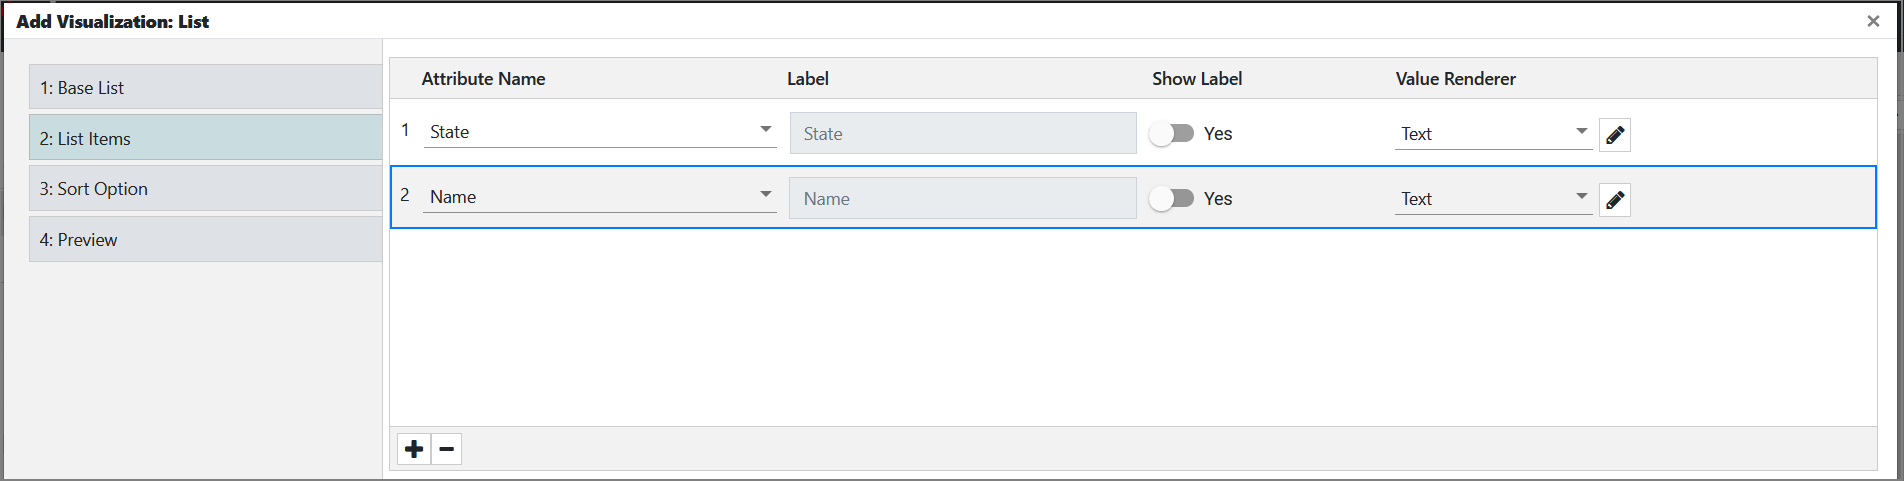
– In Visualization Name, provide a name (for example, States and Parks).
– In List Items, click + twice to display two rows.
– From the Attribute Name dropdowns, select State and Name.
– Disable the Show Label toggle switch for both attributes.
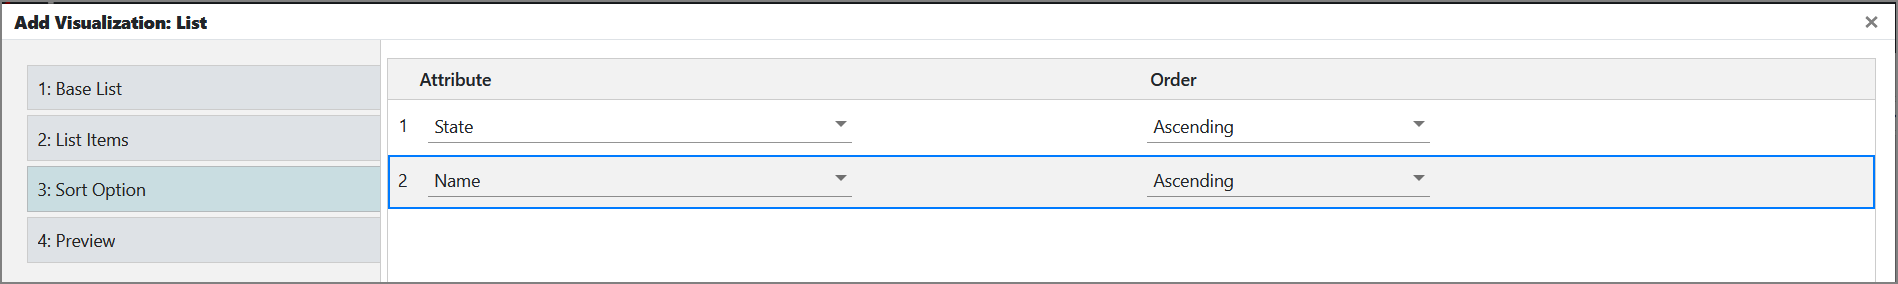
– In Sort Option, add two rows and select to sort (Ascending) by State and then Name.
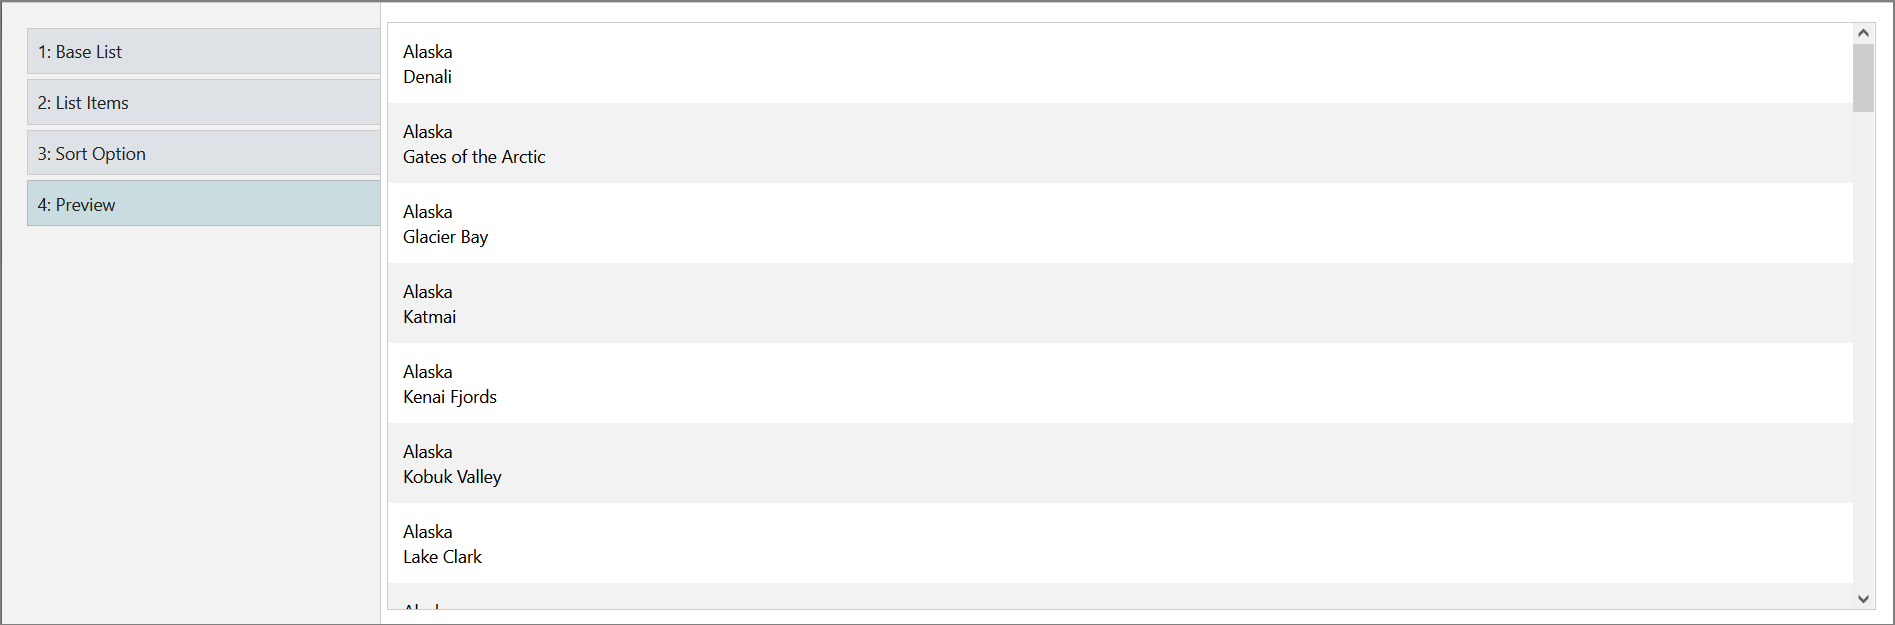
– Go to the preview and save the visualization.
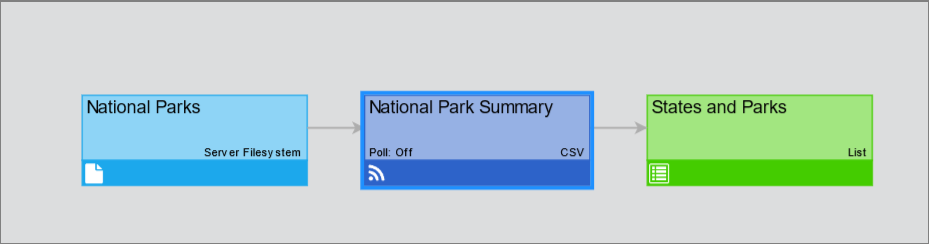
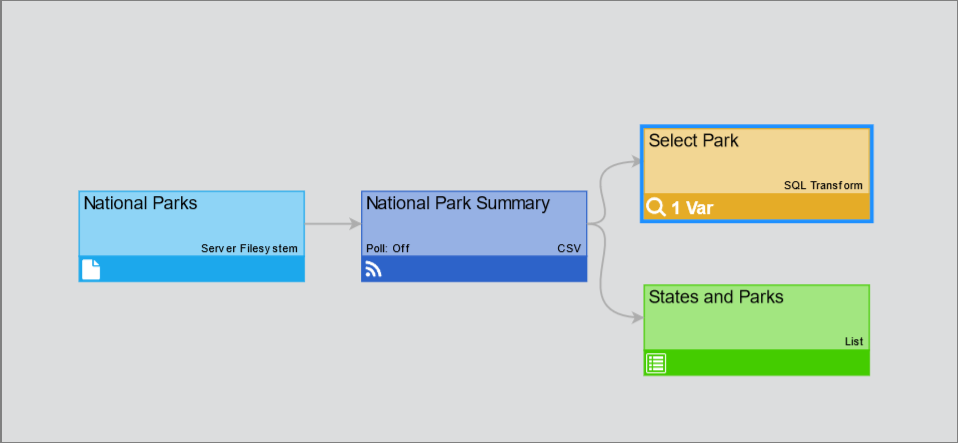
The pipeline will look like this:
Filter the Data
You will create an Action that will filter the data going into the HTML Template Visualization so that it will show information for a selected state.
Perform the following steps to create a Transform from the National Park Summary CSV Feed:
- Click the gear icon button in the National Park Summary CSV Feed box, select New (+), and then select New Transform.
- Select SQL Transform.
A new page is displayed. - In Configure, do the following:
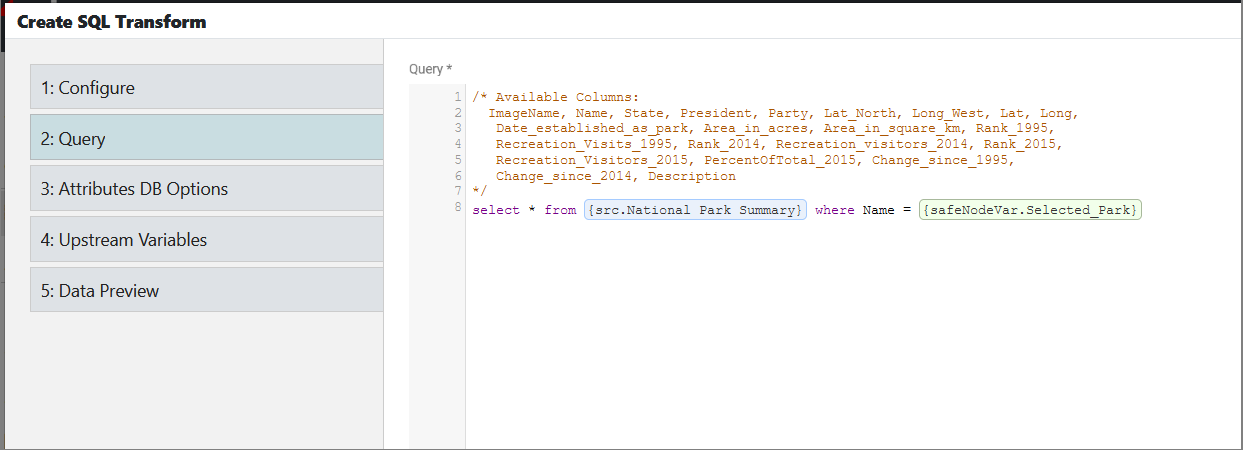
a) In Transform Name, provide a name (for example, Select Park). - In Query:
a) Next to select * from {src.National Park Summary} paste the following:
where Name =
b) Click in the space next to the equals ( = ) sign.
c) Click Insert Variable and select Node Variable from the drop-down.
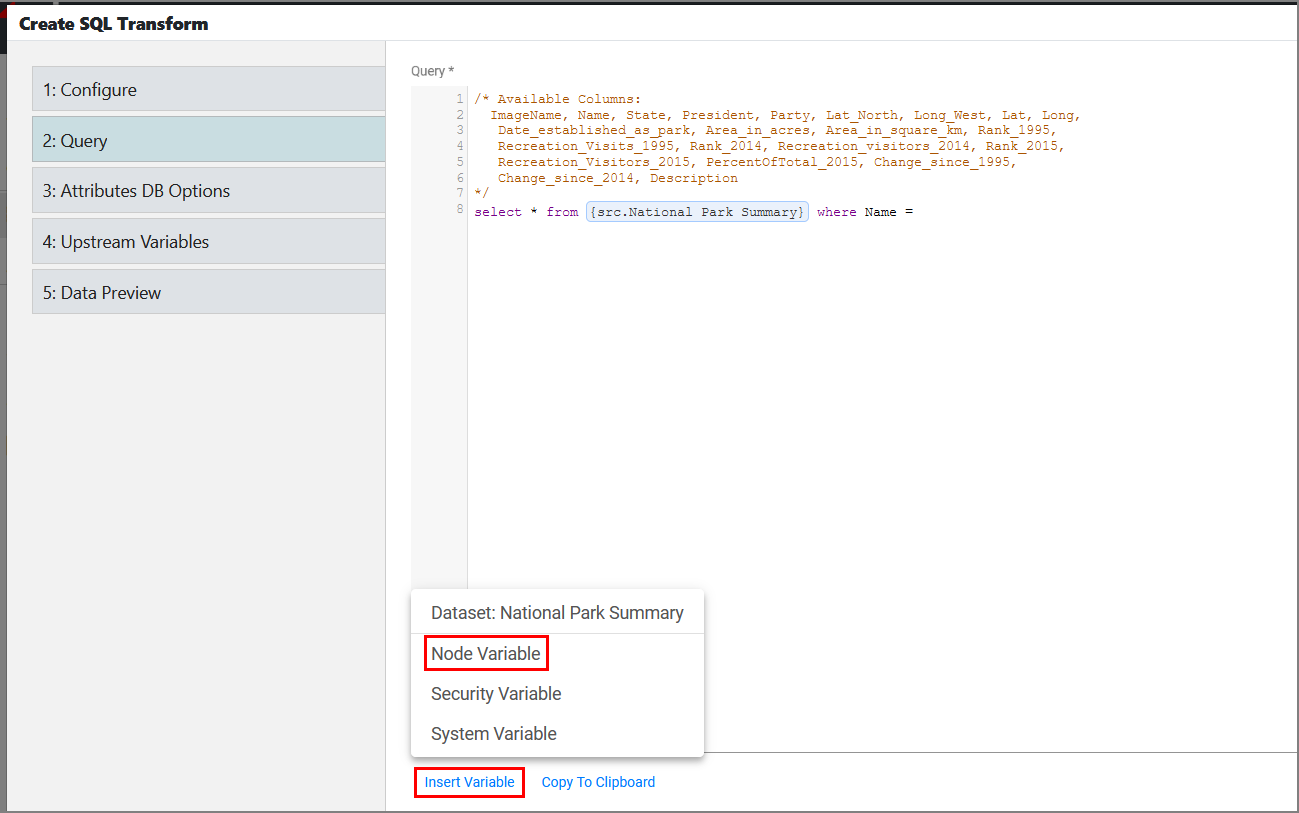
d) Click + to create a new node variable.
– In Name, enter Selected_Park.
– Leave the Unused toggle switch disabled.
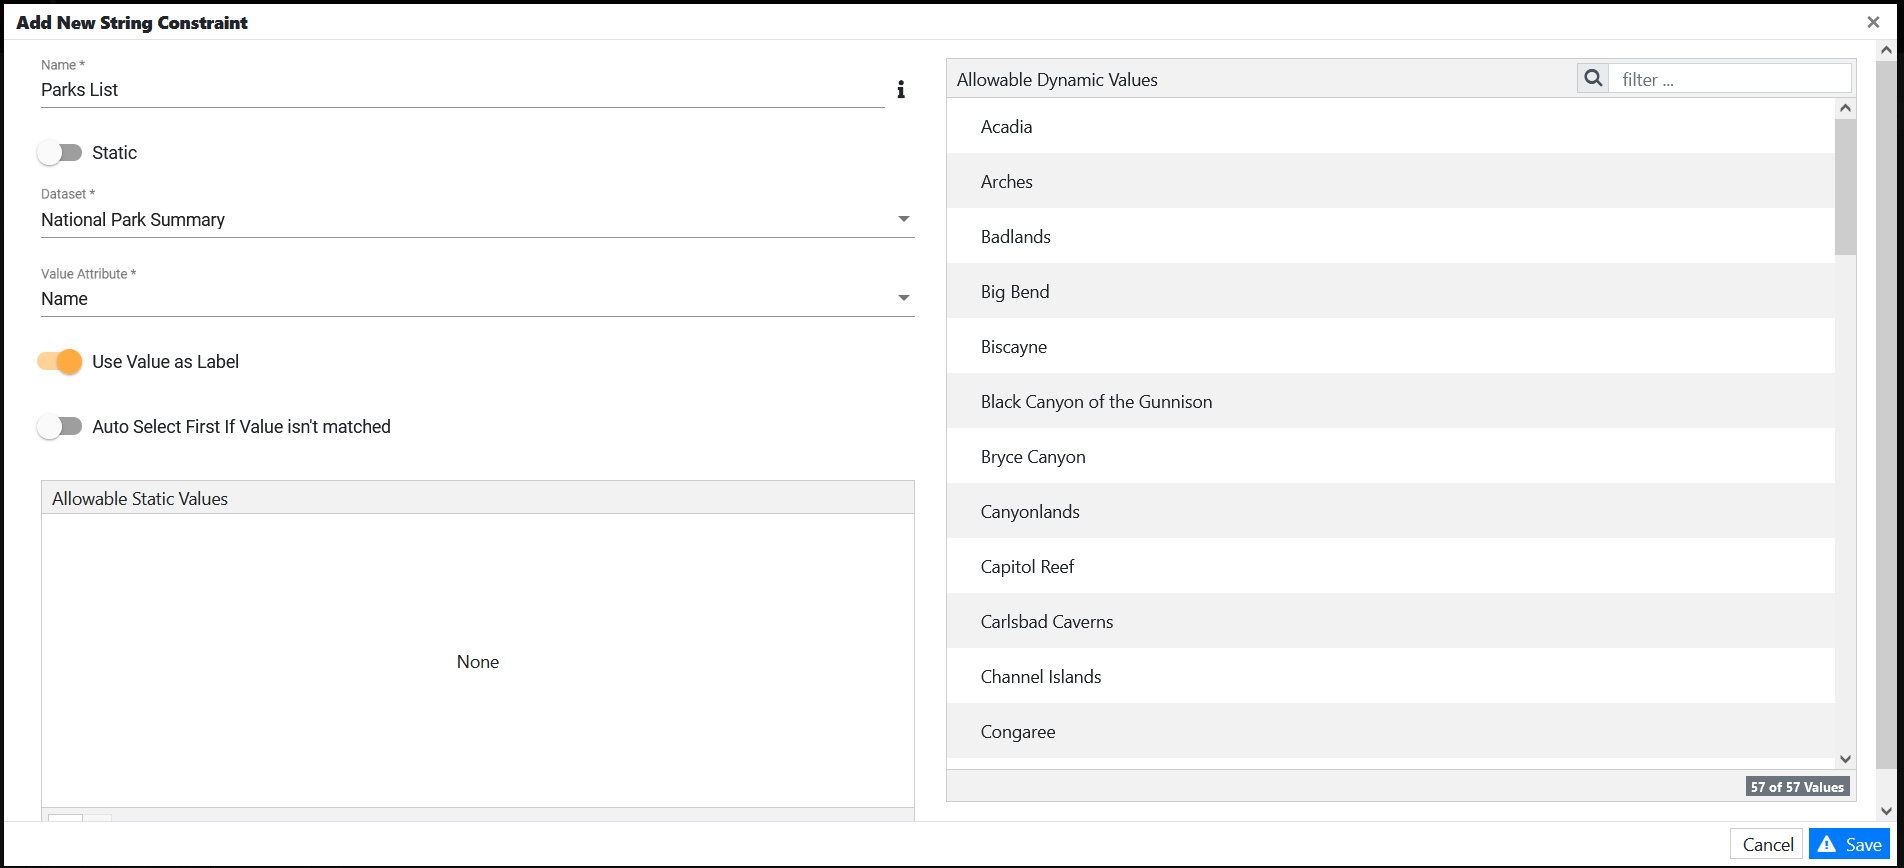
– In Constraint, click +.
– In Constraint Data Type, select String and click OK.
– In Name, enter Parks List.
– Disable the Static toggle switch.
– In Dataset, select National Park Summary.
– In Value Attribute, select Name.
– Enable the Use Value as Label toggle switch.
– Click Save.
You are taken back to the Add Variable screen.
– In Default Value, select Badlands.
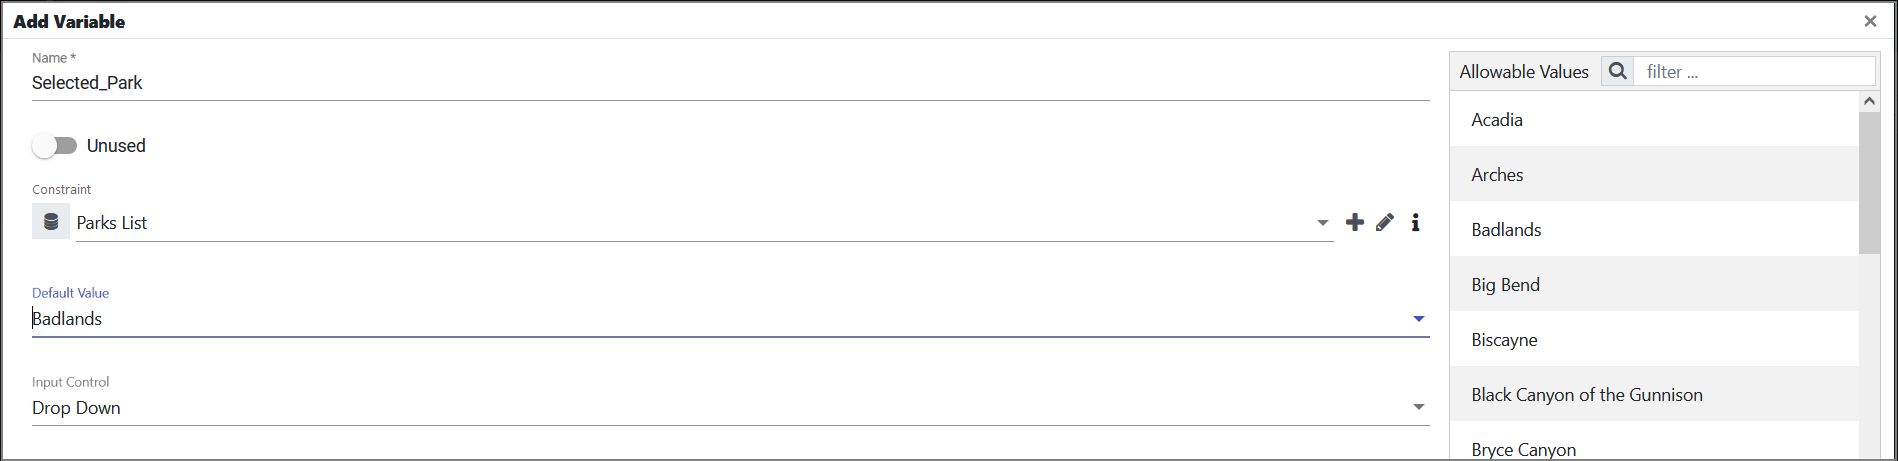
– Click Save.
e) Click on the Selected_Park variable to select it.
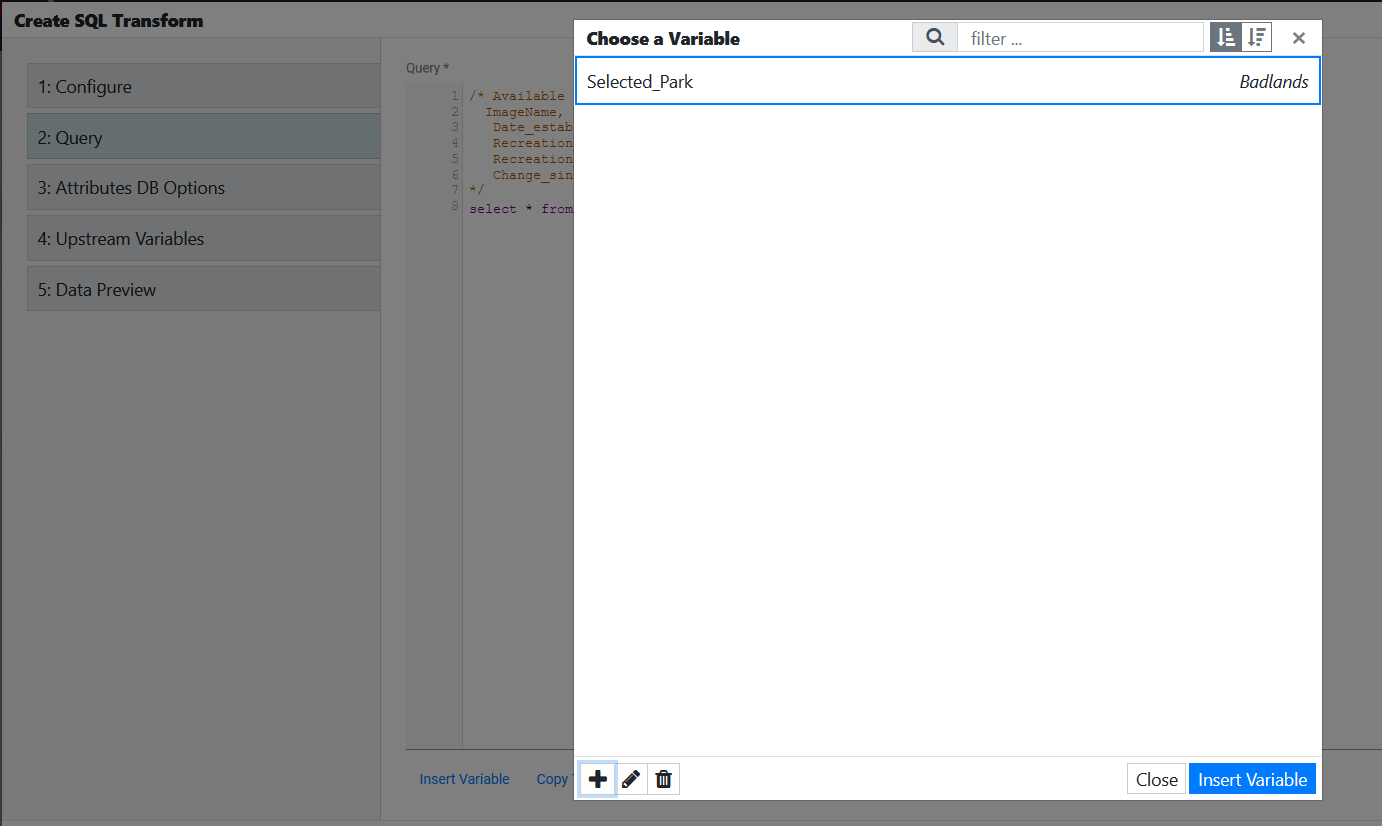
f) Click Insert Variable. The Query box should now say:
select * from {src.National Park Summary} where Name = {safeNodeVar.Selected_Park}
g) Click Next.
No changes are needed in Attributes DB Options and Upstream Variables. - In Data Preview, observe the data preview of the Select Park SQL Transform from the National Park Summary Connection. Only data for the default park is shown (Badlands).
- Click Save and Close.
The transform is shown in the pipeline.
Create an HTML Template Visualization
You will create an HTML Template Visualization that will display several data values and a background image for a selected state.
Perform the following steps to create an HTML Template Visualization:
- Off of the Select Park SQL Transform, create an HTML Template visualization.
- In the Configure tab, in Name, provide a name (for example, Park Detail).
- In the Renderer tab, do the following:
a) In HTML, enter the following code:<div *ngFor="let row of rows"> <div class="parksInfoBKG" [ngStyle]="{'background-image':rows[0].ImageName != undefined ? 'url(custom/Parks/' + rows[0].ImageName : ''}"> <div class="parksInfo"> <h1 class="parksInfoHeader">{{rows[0].Name}}</h1> <table><tbody> <tr><td class="fieldName">State</td><td class="fieldValue">{{rows[0].State}}</td></tr> <tr><td class="fieldName">Area</td><td class="fieldValue">{{rows[0].Area_in_acres}}</td></tr> <tr><td class="fieldName">Description</td><td class="fieldValue">{{rows[0].Description}}</td></tr> <tr><td class="fieldName">Created By</td><td class="fieldValue">{{rows[0].President}}</td></tr> </tbody></table> </div> </div> </div>b) In LESS/CSS, enter the following:
.parksInfoBKG{ width:100%; height:100%; background-repeat:no-repeat; background-size:cover; background-position:center center; -webkit-transition: background-image 2s ease-in-out; transition: background-image 2s ease-in-out; } .parksInfo { //background-color: rgba(0,100,0,3); text-shadow: 1px 1px 3px rgba(0,0,0,.3); padding:20px; table { table-layout:fixed; width:100%; } } .parksInfoHeader { color:blue; margin:0px; } .fieldName { color:white; font-weight:bold; padding-right:10px; text-align:right; width:200px; vertical-align:top; } .fieldValue { color:white; } - Go to Preview, where you can observe the HTML component showing information about the Badlands national park.
- Click Save and Close.
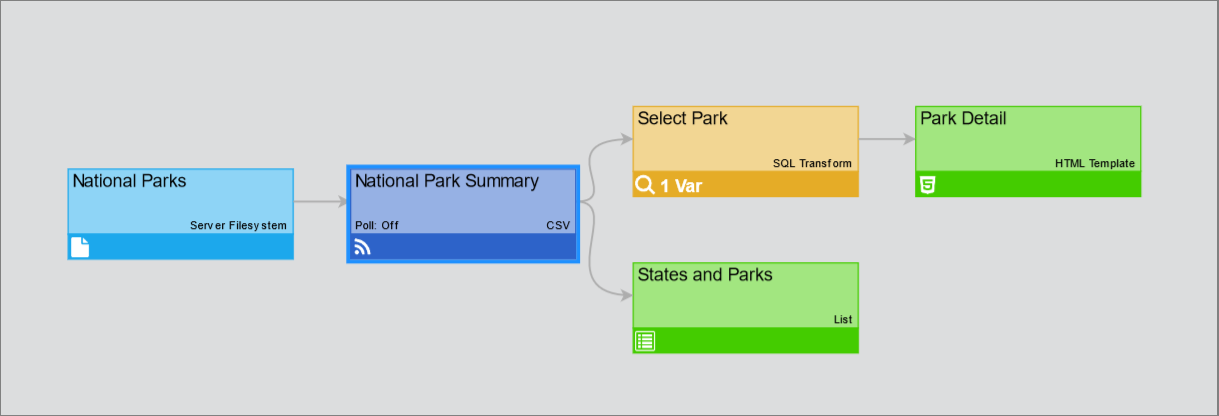
The pipeline looks like this now:
Create a Page
- Create a page titled National Parks.
- Access the newly created page in the menu.
- Click the Edit button in the top-right corner.
- Click in the + Add Visualization box.
The Add Visualization pop-up is displayed. - In the pop-up, type States and Parks or select View All to view the full pipeline and then find States and Parks.
- Click to select the States and Parks List Visualization.
- Click the Add Visualization button.
The visualization is added to the National Parks page. Now we are going to add the HTML template visualization to this page, too. - On the National Parks page, in the top-right corner, click the three dots and then click Add Column to Right.
- Click in the + Add Visualization box and find the Park Detail HTML Template Visualization.
- Click to select the Park Detail HTML Template Visualization.
- Click the Add Visualization button.
The HTML visualization is added to the page. You can click and drag the center separator bar so the List Visualization is narrower and you can see more of the HTML Visualization. - Click Save Page.
In the Edit mode, you will see the Page Variables sidebar on the left, where the previously created Selected_Park variable is displayed with its default value Badlands.
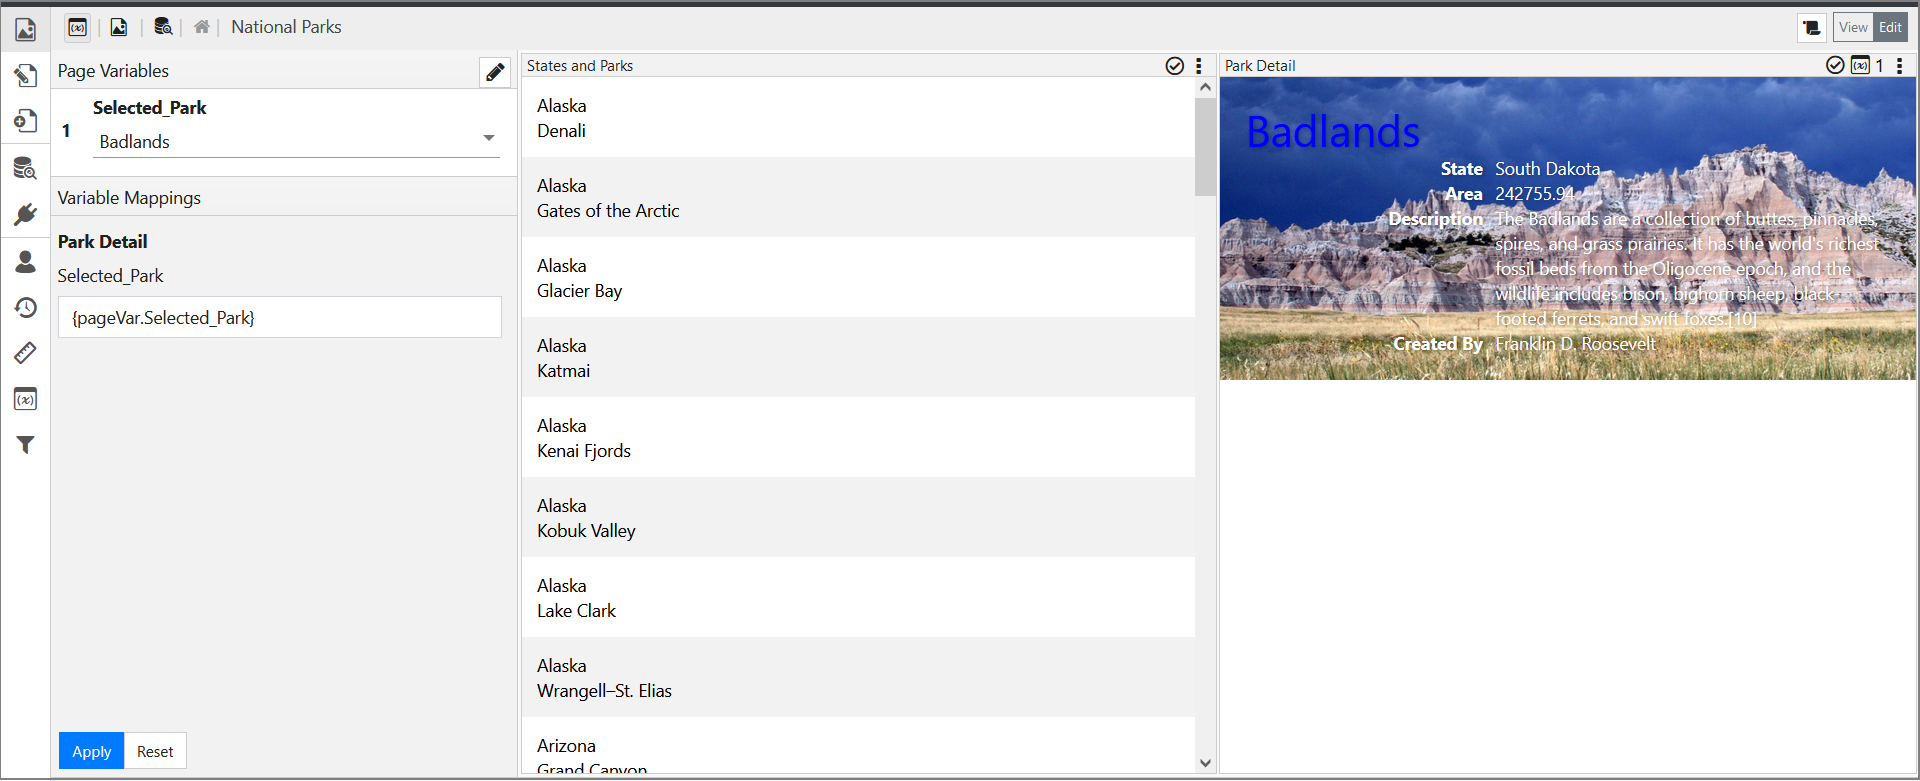
Select any park from the drop-down, click Apply and observe how the applied park is displayed in the HTML template visualization on the right.
Create a Set Page Variable Action
Here we are going to create a visualization action that will set a page variable. In our example, when we click on a park in the States and Parks list, the action will be performed, and the park we clicked on will be displayed in the HTML.
Perform the following steps:
- In the States and Parks List Visualization, click the three dots and select Edit Actions.
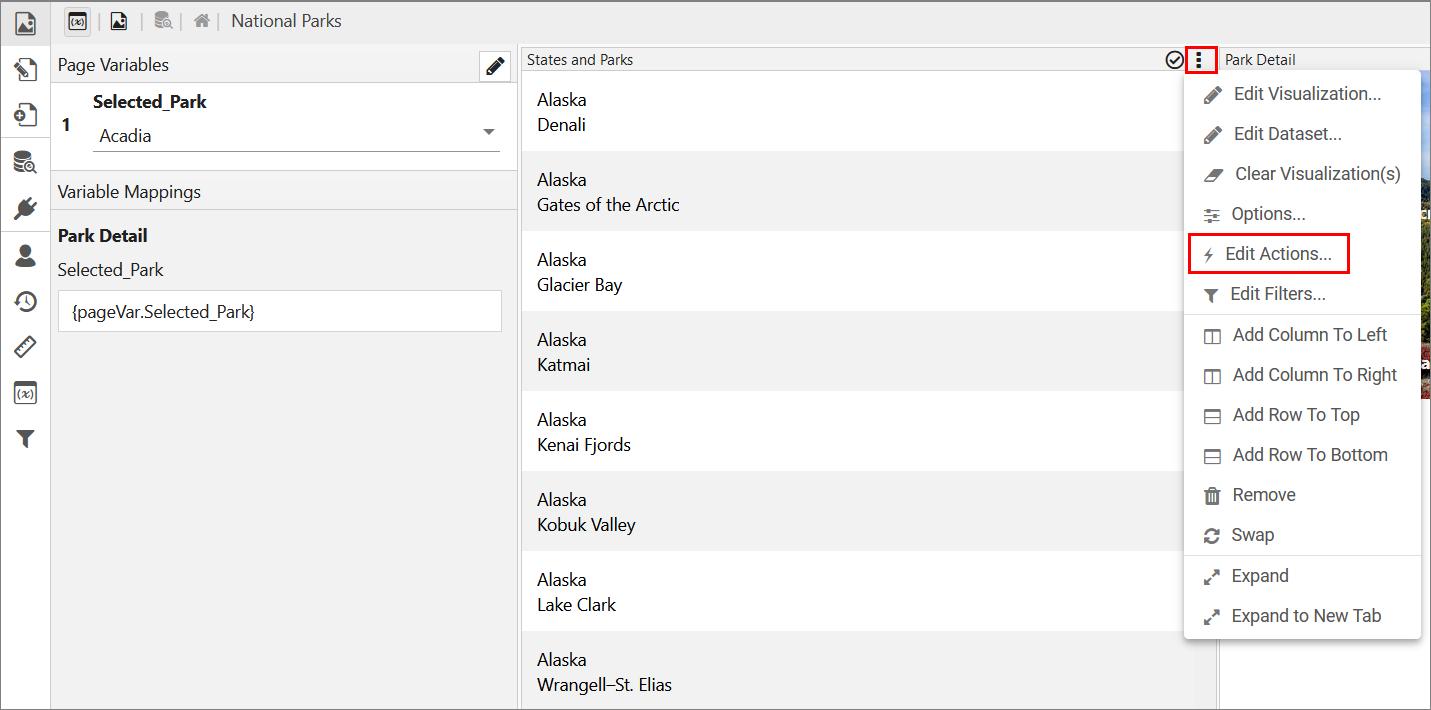
A pop-up is displayed. - In the pop-up, click + > Click Item > Set Page Variable.
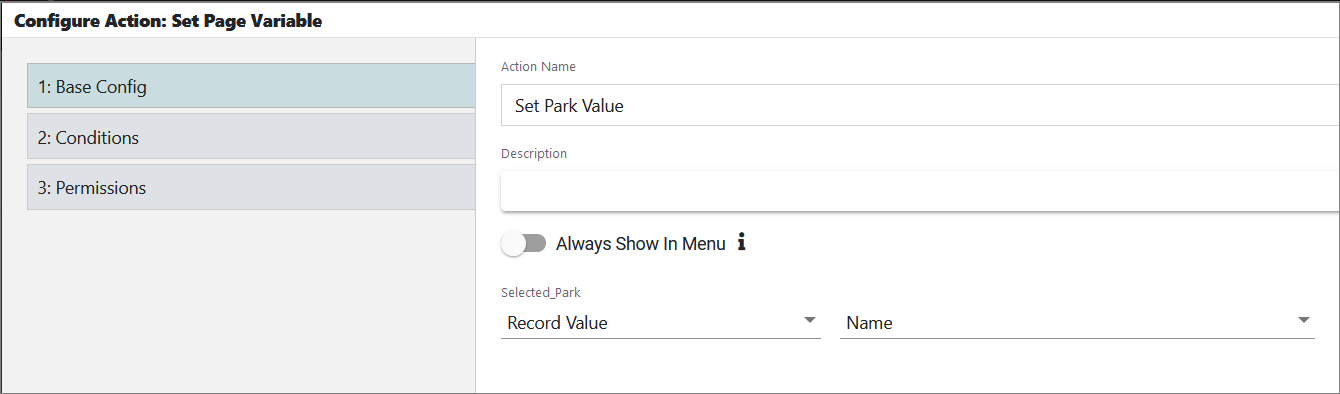
A new page is displayed. - In Action Name, enter Set Park Value.
- (Optional) Enable the Always Show In Menu toggle switch if you want to see the action in the menu once it is created. As a result, the action will be shown upon clicking the item.
- In the Selected_Park dropdown, select Record Value and Name.
- Click Next.
No changes are needed in Conditions or Permissions. - Click Save and Close.
- The action is displayed in the pop-up. Close the pop-up.
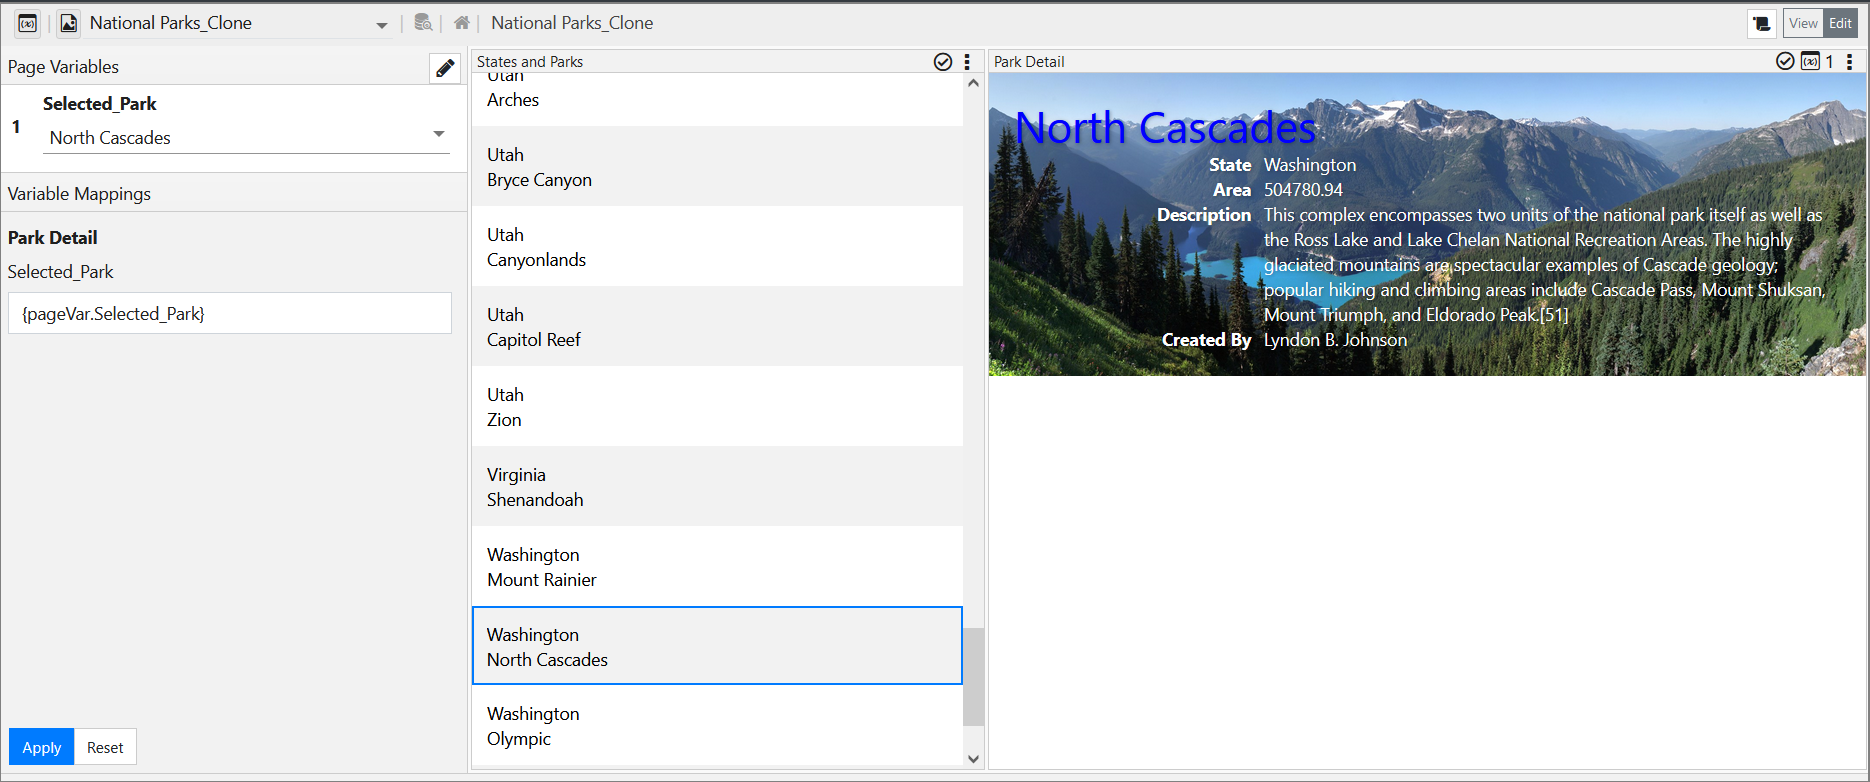
To validate the Set Page Variable Action, click any park in the States and Parks List Visualization. Observe that the detail for that park is then shown in the Park Detail Visualization.
If you want to see the default value (Badlands), click Reset in the bottom-left corner.
Exercise Summary
You have loaded National Parks CSV data and images in the edgeCore file system, and then you have created a List Visualization that displays the name of each park and the state where it is located. Afterward, you have created an HTML Template to provide a formatted HTML display for a selected park and an action to pass a selected park value into that Visualization.