A client filter reduces the number of records displayed in a visualization. It does not affect what gets returned from the server. To limit records returned from the server, administrators use variables inside of queries, which ultimately get displayed as page variables. Client filters are a separate concept and act as a second layer of filtering. The two concepts are visually separated within the product as well. Server filters show up as page variables while client filters are displayed on the individual visualizations they affect.
Client filters can be used in conjunction with server filters. The server filter is always applied first, limiting what is returned from the server. The client filter then runs against that result set, allowing it to be filtered again. It is important to keep this relationship in mind because it can be easy for a server and client filter to fight with one another.
Adding a Client Filter
To add a client filter, perform the following steps:
- Log in to edgeCore as an administrator.
- Open a page in the Edit mode.
- In the top-right corner of the visualization to which you want to add a client filter, click the three dots to show the options drop-down menu.
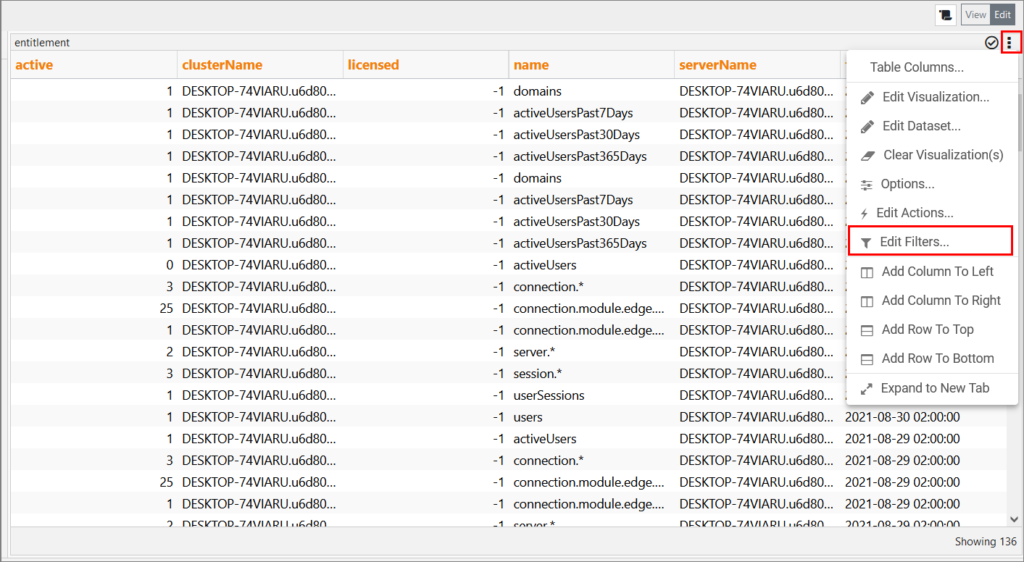
- Select Edit Filters.
A pop-up for managing client filters will be displayed. - Click + to add a filter.
A new page is displayed. - Select the filter you want and click Use Selected.
The selected filter will be displayed in the pop-up for managing filters. - Configure the filter and save your changes.
The filter will be applied to the visualization to which you added it.
Filter Types
edgeCore ships with several different types of client filters.
| Filter | Description | Output |
|---|---|---|
| Client Pagination | Limits records by a configured number of rows and allows an end-user to “page” through the results. | |
| Custom Expression Filter | Limits records by a custom expression that can compare values in multiple attributes. | |
| Date Range Picker | Limits records by a date range. This filter uses a calendar input and lets the user select both a Start and End date. | |
| Date Range Slider | Limits records by a date range. This filter uses a slider input and has an option to summarize the underlying data. The slider is placed on top of a sparkline chart which can provide context for selection. | |
| Realtime Date Filter | Limits records by a date range. This filter binds the End Date to the current date and time. It allows a user to select how far back in time to go using a set of durations. | |
| Search Field | Limits records by a supplied value. This filter allows a user to type characters into a text input, and then shows only those records which contain values that match. | |
| String Constraint Filter | Limits records by a supplied value. This filter can be bound to a set of constraints, which show unique values for a specified attribute. | |
| Sort | Sorts records in ascending and/or descending order. | |
| Row Limit | Limits the rows for any given visualization.
This filter can limit the first x number of rows or the last x number of rows. |
Persistent Filters
User-applied filters for a visualization can be persisted during a session, across the user’s sessions on the same browser, or none at all. The behavior can be managed by setting the edge property key: client.filter.persistentStrategy to one of the following values:
| Value | Description |
|---|---|
| none | This was the behavior before version 3.8.4. Every visit to the same page starts with no filter setting set. |
| session | Filter setting for each visualization is persisted during the duration of the user’s session. This is the default behavior. |
| user | Filter setting for each visualization is persisted across the user’s different sessions on the same browser. Multiple users can use the same browser without causing any issues. |