A TreeMap Visualization shows relationships based off of nodes. It requires a TreeMap Relational Model, which is just a mechanism used to define relationships within the data. Because of this dependency, TreeMap Diagram Visualizations will only appear as an option off of TreeMap Relational Models.
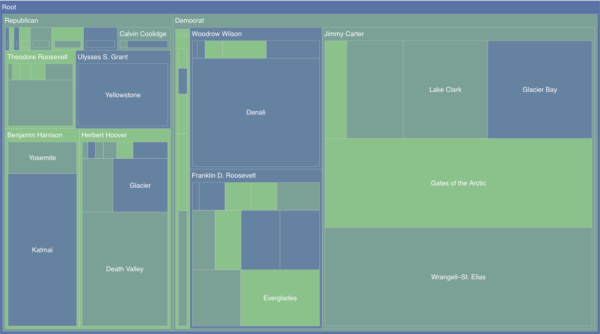
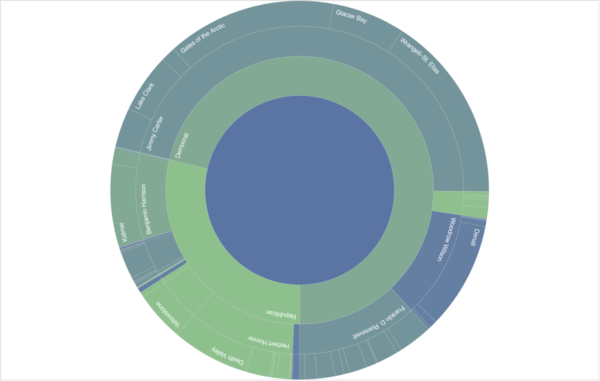
The examples above show a TreeMap Diagram (left) and a Sunburst Diagram (right).
Flow Diagrams
There are two different types of Tree Visualizations available in edgeSuite.
1. TreeMap Diagram

TreeMap displays hierarchical data as a set of nested rectangles. Each branch is represented by a rectangle. Sub-branches are shown as smaller rectangles, which are tiled inside of their parent branch. Leaf nodes appear as rectangles as well, but they are given a size proportional to a specified attribute or number of records.
2. Sunburst Diagram

A Sunburst is similar to a TreeMap, except it shows a radial summary. Each branch is represented as a concentric circle, with sub-branches growing outward. Leaf nodes appear on the outermost circle, and are scaled proportionally based on the number of records in the dataset, or a specified attribute.
Double-clicking a “slice” in the TreeMap or Sunburst visualization will drill down into the data, and double-clicking again will toggle back to the full tree map.
Treemap Configuration
Configuring a Treemap involves three steps:
- Configure
- Renderer
- Preview
Step 1: Configure
Name
A symbolic name used to represent this Visualization. This is the name that will show up in choosers when adding a Visualization to a Page.
Diagram Type
Determines the type of diagram that will be rendered. Options are:
| TreeMap |  |
| Sunburst |  |
Allow Diagram Type Change
Determines whether an end user will be able to change the Default Diagram Type. Options are:
| Yes | An end user will be able to change the diagram type at run time. The option will appear as a button in the Visualization’s footer. |
| No | This option will be hidden from end users. |
Animation Duration (ms)
Defines the length of the animated transition in milliseconds. The larger the value, the longer the transition will be.
Step 2: Renderer
The Renderer step will display a renderer configuration for each level of the TreeMap that has been configured in the TreeMap Relational Model.
The renderer only affects how elements are displayed. Since reordering the attributes affects aggregated counts, it must be done inside the Relational Model itself.
TreeMap Value Field
The name of the attribute as defined in the relational model that will provide the value to be used for comparison in the TreeMap.
Color Selection
Choose the way the TreeMap will be colored. The two options are:
- From Palette
Choose a Color Palette and the colorization of the TreeMap will iterate through all the colors in the palette. If there are more unique values than colors, the renderer will wrap and start over reusing the same palette. See Color Palettes for additional information. - Derived From Ruleset
Choose a Color RuleSet and then satisfy its variables with fields in the Relational Model to get the TreeMap to choose colors based on calculations in the data.
Step 3: Label Options
Labels affect how individual values are rendered within the Visualizations.
Color
Affects the color of all labels.
Size
Affects the size of all labels.
Style
Affects the style of all labels.
Step 4: Preview
Preview your configuration on the last step of the wizard.