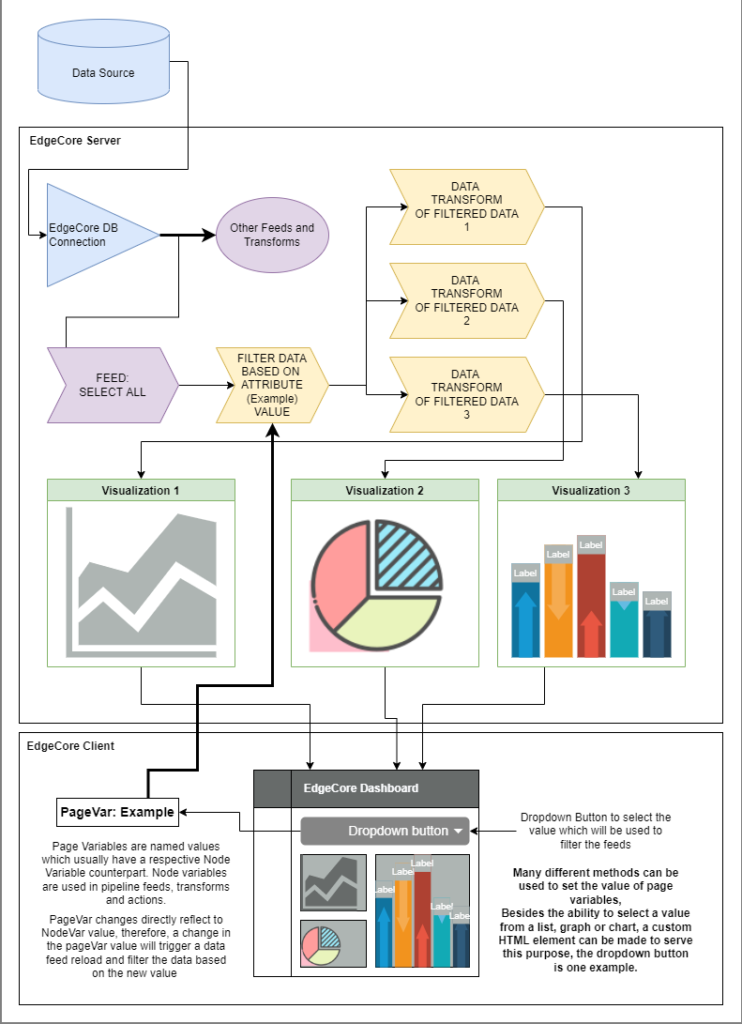
For the purpose of this example, there is a dashboard that can have multiple visualizations and data sources but needs to be filtered based on a specific set of parameters. The dashboard renders information about task items and needs to be filtered based on the Client name column in the database.
edgeCore provides each visualization with a separate filter option, but changing those values does not reflect the data in other visualizations. The solution provided here filters the data on the pipeline level. Therefore, it can influence the results of multiple visualizations and feeds. Here is a simplified diagram of how this flow works:
Video Tutorials
Watch the following videos for further instructions:
- Introduction
- Connection and Feed
- SQL Transform Filter
- Filter and Constraint
- Visualization and Dashboard
- HTML Dropdown button
- Additional Transforms and Visualizations
MySQL Queries Used
The following MySQL queries were used in the video tutorials:
1
select * from {src.SelectAll} where itemClientName LIKE {safeNodeVar.FilterClientName}
2
SELECT
(select count(*) as pending
from {src.FilterByClient}
where itemStatus = ‘Pending’
) AS Pending,
(select count(*) as completed
from {src.FilterByClient}
where itemStatus = ‘Completed’
) AS Completed,
(select count(*) as failed
from {src.FilterByClient}
where itemStatus = ‘Failed’
) AS Failed,
(select count(*) as cancelled
from {src.FilterByClient}
where itemStatus = ‘Cancelled’
) AS Cancelled,
(select count(*) as inprogress
from {src.FilterByClient}
where itemStatus = ‘InProgress’
) AS InProgress,
(select count(*) as review
from {src.FilterByClient}
) AS Total
3
select AVG(itemDuration) as AverageTime from {src.FilterByClient};
Files Used
The following JSON files were used in the tutorials: