Overview
edgeCore instrumentation is available via Prometheus, an open-source time-series monitoring tool. edgeCore uses Micrometer to record metrics that are then scraped by Prometheus based on polling intervals. Prometheus stores metrics in a time-series database with dimensions. All edgeCore metrics include the tags: ‘application’: ‘edgecore’ and ‘cluster’: ‘standalone’. The cluster tag value should be renamed when the metric is scraped during a polling interval to properly identify the server or the environment. Additionally, tags are added to the Prometheus scrape configuration (also known as ‘labels’), which include job_name and possibly group name to be used to identify the system (prod, QA, or dev).
Metrics are split into three categories: Gauges, Counters, and Timers. Micrometer allows other Monitoring Systems to be dropped in as well.
Available Metrics
Micrometer supports three different types of metric categories: Gauge, Counters, and Timers. Initial metrics center around logins, page access, and job information, plus a number of default bindings used to track Java and system performance.
edgeCore Application Metrics:
- Active Sessions Gauge (‘active_sessions’) tracking current users logged in (all sessions on the cluster).
- Login Counts (‘sessions_login’) tracking count of logins with tags: ‘domain’, ‘user’, and ‘useragent’.
- Page Access Counts (‘pageaccess’) tracking pages accessed via the browser with tags: ‘domain’, ‘user’, ‘path’, ‘pagerRef’.
- Job Records Size Gauge (‘job_data_size_results’) with tags: jobType, producer, and params.
- Job Memory Size Gauge (‘job_data_size_memory’) with tags: jobType, producer, and params.
- Job Timer (‘job_timer’) with tags: jobType, producer, and params.
Endpoint Security
edgeCore expects access to the additional management endpoints from specific hosts. By default, the IP Address Filter is limited to ‘127.0.0.1’ localhost access. This can be adjusted by adding the following line to [Install_Home]/conf/custom.properties:
security.management.hasIpAddress=127.0.0.1/16
This setting should be the IP Address of the Prometheus server.
Prometheus Architecture
The illustration below represents the primary interactions between edgeCore and Prometheus, which will be detailed in the following sections.

Installation and Configuring Prometheus
Setting up Prometheus is possible inside and outside of a docker container. Setting up Prometheus in both of these instances is a fairly simple process and requires a YAML File, which is a configuration file for Prometheus, and also a dockerfile if run inside a container.
Docker Installation
Prometheus can also run inside a docker container together with an edgeCore docker container in the same network and on the same server. Setting up Prometheus inside a docker will require a dockerfile and YAML format configuration file, as there is already a preloaded Prometheus image for docker. The docker file should look like the following:
![]()
This will deploy an instance of the Prometheus image inside a docker container and also add the YAML configuration file. You will need a docker file for setting up the edgeCore instance inside of docker, which should look like the following:
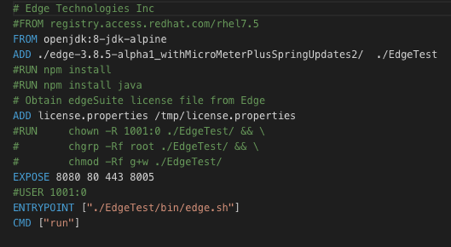
You will need an edgeCore build which will run inside the docker container. Once the docker files are created, it will require that you build docker images which are done by navigating to the folder where your dockerfile and YAML File are located and running:
docker build -t prometheus .
Similar to building a docker image, navigate to the edgeCore docker folder where your docker file and edgeCore build is located and run:
docker build -t edgeCore .
These commands will build a local image for both docker containers on your machine.
YML Configuration File
Prometheus will require a YAML File, which represents a configuration file where you will set up a location, interval, and job rules for scraping from the specific location. The following is an example of a YAML File:
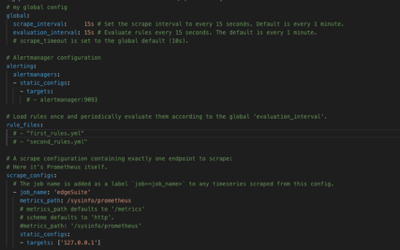
This will scrape all metrics at the location 127.0.0.1/sysinfo/Prometheus (local instance).
Configuration
Once Prometheus and edgeCore (or their docker containers) are started up, the first thing should be to verify if Prometheus is successfully scraping the required metric data:
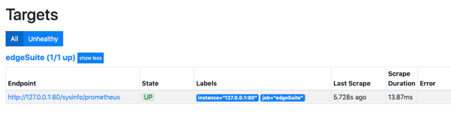
Prometheus is by default set to localhost:9090. On the “Targets” page in Prometheus, verify if the edgeCore job has State UP which means it is successfully scraping from the location you specified in the .yml file.
Targets Monitoring Multiple Edge Instances
It is also possible to set up Prometheus to scrape from multiple edgeCore instances by configuring the YAML File. This is achieved by adding additional targets inside a configuration file:
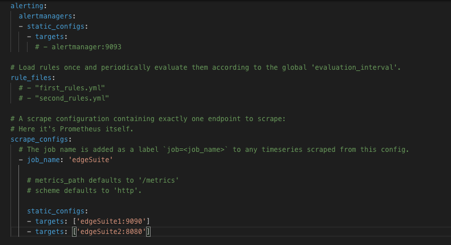
If you are running Prometheus inside containers, any additional edgeCore container will have to be set into the same network in order to properly scrape from it.
Running Prometheus
If Prometheus is installed outside of docker, it will require you to download it from the following URL:
https://prometheus.io/download/
After unpacking Prometheus and setting up the YAML file you can start the instance by running the following command:
./prometheus --config.file=prometheus.yml
If you are running Prometheus through a docker container, after setting up the dockerfile and YAML file you can start the docker instance locally by running the following commands:
docker run -p 9090:9090 prometheus – Prometheus docker
docker run -p 8080:8080 edgeSuite – edgeCore docker
edgeCore Prometheus Connections and Feeds
Once Prometheus is connected and successfully scraping data from edgeCore, the next step is to set up a Prometheus connection in edgeCore. That can be done manually, or by using a Prometheus adapter that contains a content bundle with preset Feeds and Transforms examples that will help you familiarize yourself with it.
The following sections detail the steps for the manual setup. The final section will then detail the steps for installing the adapter with the sample bundle.
Connection
First set up a web data connection inside the edgeCore pipeline. The following is an example configuration:

edgeCore uses the “Generic Web Data” connection type to connect to Prometheus and there is no need for an SSO handler.
Custom JavaScript Feed
After the connection is set up, the next step is to set up the required data feed. Connecting Prometheus data is done via a Custom feed using JavaScript that converts the required attributes and data. The following is an example feed configuration:

function getAttributes(inputString, nodeVars, secVars) {
            // TODO: Create an array of attribute objects following the sample below
            // use inputString to derive attributes
            // Note: inputString can be anything: JSON, CSV, XML, etc.
            // The method of parsing the data is up to the user

            var attributes = [];
            var Application = {
                        name : ‘Application’, // Alphanumerics and underscores only; no leading, trailing, or adjacent underscores
                        type : ‘string’, // ‘string’|’int’|’long’|’number’|’boolean’|’date’
                        isId : false, // true|false
                        format : null // string consisting of valid Java SimpleDateFormat pattern
            };
                        var Instance = {
                        name : ‘Instance’, // Alphanumerics and underscores only; no leading, trailing, or adjacent underscores
                        type : ‘string’, // ‘string’|’int’|’long’|’number’|’boolean’|’date’
                        isId : false, // true|false
                        units : ‘millis’, // ‘millis’|’seconds’ (if attribute is timestamp)
                        format : null // string consisting of valid Java SimpleDateFormat pattern
            };
                        var Cluster = {
                        name : ‘Cluster’, // Alphanumerics and underscores only; no leading, trailing, or adjacent underscores
                        type : ‘string’, // ‘string’|’int’|’long’|’number’|’boolean’|’date’
                        isId : false, // true|false
                        units : ‘millis’, // ‘millis’|’seconds’ (if attribute is timestamp)
                        format : null // string consisting of valid Java SimpleDateFormat pattern
            };
            var Time = {
                        name : ‘Time’, // Alphanumerics and underscores only; no leading, trailing, or adjacent underscores
                        type : ‘number’, // ‘string’|’int’|’long’|’number’|’boolean’|’date’
                        isId : false, // true|false
                        format : null // string consisting of valid Java SimpleDateFormat pattern
            };
            var Value = {
                        name : ‘Value’, // Alphanumerics and underscores only; no leading, trailing, or adjacent underscores
                        type : ‘number’, // ‘string’|’int’|’long’|’number’|’boolean’|’date’
                        isId : false, // true|false
                        format : null // string consisting of valid Java SimpleDateFormat pattern
    };
                        attributes.push(Application);
                        attributes.push(Instance);
             attributes.push(Cluster);
                        attributes.push(Time);
                        attributes.push(Value);

            return jsAttributesSuccess(attributes, “Example Success”);
            // can optionally return jsAttributesFailure(failureMsg) to handle failures
}

function getRecords(inputString, nodeVars, secVars) {
            // TODO: Create an array of record objects
            // use inputString to derive records
            var records = [];
    var i = 0;
    var myJson = JSON.parse(inputString);
    myJson.data.result.forEach( function(metricObj) {
      metricObj.values.forEach( function(metricValues) {
      //for ( var i=0; i< metricObj.values.length; i++ ) {
        i++;
         var record = {
            ‘Application’ : metricObj.metric.application,
            ‘Instance’ : metricObj.metric.instance,
            ‘Cluster’ : metricObj.metric.cluster,
            ‘Time’ : metricValues[0],
            ‘Value’ : metricValues[1],
         };
         records.push(record);
      });
    });
            return jsRecordsSuccess(records, “Example Success”);
            // can optionally return jsRecordsFailure(failureMsg) to handle failures
}
After the feed is created and metrics are pulled from Prometheus into edgeCore, a time conversion operation must be completed. This is because Prometheus registers the epoch time when scraping data and saving metric values. The following is an SQL transform query to successfully convert the time:
select Application,Instance,Cluster, dateadd( second, Time, CAST( '1970-01-01' as datetime ) ) AS Time,Value as Count from {src.ActiveSessions}
After the transformed query has successfully completed, the metric data is ready to be ingested for creating further visualizations or transforms depending on your need.
Prometheus API calls
Data from Prometheus is retrieved by running API calls with a query to the Prometheus page.
The format of start URI should be like /api/v1/query?query= and you add the query of the value you would like to retrieve. These are all the values that edgeCore is currently retrieving from Prometheus in the content bundle:
/api/v1/query?query=sessions_active[10m]– Number of active sessions
/api/v1/query?query=process_cpu_usage{job="edgeSuite"}[5m] – CPU Usage in the last 5 minutes
/api/v1/query?query=log4j2_events_total – Total count of each type of event in edgeCore
/api/v1/query?query= job_data_size_memory[1m] – Job data size over time
/api/v1/query?query=job_timer_seconds_count{job="edgeSuite"} – Job count for edgeCore
/api/v1/query?query=job_timer_seconds_count{job="edgeSuite"}[5m] – Job count changes over time
/api/v1/query?query=system_load_average_1m – System load average in last minute
/api/v1/query?query=sessions_login_total{job="edgeSuite"}[5m] – Session logins over time
/api/v1/query?query=jvm_memory_used_bytes[10m] – Memory used over time
/api/v1/query?query=process_files_open_files – Opened files by edgeCore instance
/api/v1/query?query=process_uptime_seconds – Current uptime by edgeCore instance
/api/v1/query?query=pageaccess_total – Page accessed count inside edgeCore instance
/api/v1/query?query=http_server_requests_seconds_count – Proxy Gauge for each edgeCore instance
Prometheus Adapter
The steps above show how to manually create connections in edgeCore to display Edge metrics from Prometheus. This section details how to install the Prometheus Adapter which has a bundle of pre-configured Feeds, Transforms, and Visualizations.
Perform the following steps to install the Prometheus Adapter:
1. Save adapter into [Install_Home]/modules
2. Go to Manage/Adapters/Available Adapters
3. Activate adapter
4. Deploy Content Bundle
5. In the pipeline, edit the “Prometheus Test” Connection
6. Update Destination Endpoint to your Prometheus URL
Fetching Metrics Data via Edge CLI
Once a connection, feed, and (optionally) a transform has been established in the edgeCore pipeline as described above, metrics data can be retrieved using the Edge CLI fetch command. The data is returned in a comma-separated value format with the first row acting as a header row. The format for the command is fetch -p PRODUCER [-v VARS…] where PRODUCER is the name of the feed or transform, and VARS (which is optional) is a list of “key=value” pairs to set any node variables that have been defined for the producer (e.g. -v “foo=bar”). Using the above example, the command would look like:
./bin/es-cli.sh fetch -p ActiveSessions
To run the command, user credentials need to accompany the arguments, or the edgeCore server needs to be configured for pre-authenticated CLI access.
Quick start via edgeCore Prometheus Adapter and Content Bundle
The Prometheus adapter for edgeCore is currently available that utilizes a web data connection and has three available feed types (JSON, Custom Time Base script, Custom Gauge Base Script). Included with this adapter is a content bundle that contains an example Prometheus configuration with all the previously mentioned API calls and transforms together with pre-built visualizations and pages for monitoring scraped metrics from edgeCore.
<Include Directory>
Future Updates: Joining Multiple Metrics via SQL transform
There are currently plans on further updating the Prometheus example configuration with joining multiple metrics together via SQL Transforms to provide more precise data analytics and expanded functionality.