
The Map Visualization renders data that contains latitude and longitude information on a map. You can choose from several tile maps, and configure custom map markers that can show status and icons. The rendering engine is smart enough to render important markers on top of lesser ones. The marker cluster option can show cluster numbers for congested maps with status and zoom options to see the markers. If your data updates over time, an optional auto-zoom feature will keep all of the markers rendered in the window.
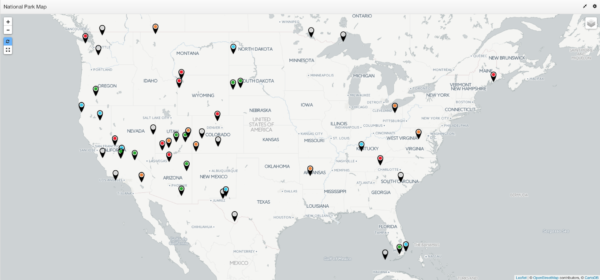
This example shows the location of national parks, and the color rules on the pins summarize the total number of visitors.
Tip: Double-clicking on a Map Visualization will zoom in one level.
Icon Map Configuration
Icon Map configuration is broken out into these main steps.
- Base Map
- Markers
- Marker Clustering (if enabled)
- Marker Labels (if enabled)
- Legend
- Optional Layers
- Weather (if enabled)
- Heat Map (if enabled)
- Preview
Step: Base Map
Visualization Name
A symbolic name used to represent this Visualization. This is the name that will show up in choosers when adding a Visualization to a Page.
Tile Provider
The Tile Provider controls what the map looks like. Each tile set provides its own look and feel, as well as min and max zoom ranges. These ranges are included on the right hand side of the pull-down.
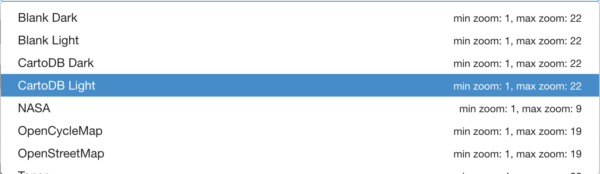
Refer to the Map Tiles and Overlays section for more information.
Default Zoom Levels
| Yes | Use the minimum and maximum zoom levels that the tile provider supports. |
| No | Specify zoom levels to support; along with the center latitude and longitude, this is good for limiting a map to a specific region. |
Minimum Zoom
Choose the minimum zoom level that the map is allowed to show. This option is only enabled when you choose No for Default Zoom Levels.
| Min | 1 |
| Max | 22 |
Maximum Zoom
Choose the maximum zoom level that the map is allowed to show. This option is only enabled when you choose No for Default Zoom Levels.
| Min | 1 |
| Max | 22 |
Auto Zoom & Center
| Yes | Let the visualization automatically zoom the map so that all map markers fit into view. |
| No | Provide your own custom center point and zoom level to start the map on. |
Zoom Level
This sets the default zoom level for the map.
- Only visible when Auto Zoom & Center = No.
- The Default Zoom Level should be set to a value within the supported range specified by the Tile Provider.
Latitude
This sets the Latitude for the center point of the map.
- Only visible when Auto Zoom & Center = No.
- Value is expected in decimal format.
Longitude
This sets the Longitude for the center point of the map.
- Only visible when Auto Zoom & Center = No.
- Value is expected in decimal format.
Zoom Control
Determine the placement of the zoom control on the map.
Enable Geocoding
Enables options for looking up current location based on an address.
| Yes | Turn on a search field for entering addresses to find on the map. Also adds a “Show my location” button to center the map on your current location. |
| No | Will not add a search field or “Show my location” button to the map. |
Step: Markers
Latitude Attribute
Choose the attribute in the data that will contain the Latitude of the marker to place. Value is expected in decimal format.
Longitude Attribute
Choose the attribute in the data that will contain the Longitude of the marker to place. Value is expected in decimal format.
Use Clustering?
Determines whether icons will be combined together based on proximity.
| Yes | When there are several markers in close proximity to one another, they will be combined into a cluster. A numeric value will indicate how many individual icons are represented by the cluster. The color of a cluster will be determined by the color rule used on the markers in the cluster.
–Static Color –Derived Color |
| No | All markers will be rendered individually. This means that a group of markers in close proximity to one another will render on top of each other. The Map Visualization is smart enough, however, to bring the more important markers to the top of the group. |
Show Label?
| Yes | Show a label along with a marker. |
| No | Show only the marker without a label. |
Marker Properties
Define a static or rule-based icon to place on the marker.
Marker Placement Type
| Pin | Places the marker horizontally centered and (using the height of the marker) above the Latitude and Longitude position. |
| Center | Places the marker centered on the Latitude and Longitude position. |
Step: Marker Clustering (if enabled)
This step is enabled on step Markers, when “Use Clustering?” = Yes.
If Heap Map option is turned on, then no clustering will be done.
Clustering Type
| Basic | Single color representing cluster icon. |
| Pie Chart | A pie chart-like rendering of cluster icon. |
Sectional Clustering Options
| Area | Specify a number indicating the area of the cluster. Higher number means more markers “merged”. |
| Icon Radius | Radius of cluster icon. |
| Icon Inner Radius | Inner radius of cluster icon. |
| Icon Inner Opacity | Inner cluster icon’s opacity. |
| Show Tooltip? | Show breakdown of the pie chart slices on mouseover; only for clusters with multiple slices. |
Step: Marker Labels (if enabled)
This step is enabled on step Markers when “Show Label?” = Yes.
Position
This option is configured in the “Marker Labels” menu, which is activated when “Use Label?” is set to Yes.
| Bottom | Place the label centered and below the marker. |
| Left | Place the label to the left of the marker. |
| Right | Place the label to the right of the marker. |
| Top | Place the label centered and above the marker. |
Derive from Attribute
Choose the attribute from the data that contains the value to be used with the label.
Label Formatter
Configure a text formatter for the label.
Step: Legend
This will appear if, in the “Markers” Section, the Formatter Type property is set to Derived From. The legend’s colors and labels will be rendered from the derived rules’ color and label. See Rule Sets for more detail.
Position
The location of the Legend box on the map.
- Bottom Left
- Bottom Right
- None: turn off the legend.
- Top Left
- Top Right
Title
Available when “Position” is not set to None. Optional title for the legend box.
Text Color
Available when “Position” is not set to None. Determines the text color of the legend’s title and key labels.
Step: Optional Layers
Weather?
| Yes | Show a translucent weather layer above the map. Choosing Yes will add another step to the wizard to configure the Weather layer. |
| No | Do not add a weather layer to the map. |
Step: Weather (if enabled)
![]()
Available options are as follows:
- Enable Layer – Choose which weather layers you would like to enable by turning on this toggle switch;
- On by default – When this toggle is enabled, the layer will be visible on a newly initialized map; If the toggle is disabled, the user can enable the layer manually on the visualization later.
- Layer Opacity – Enables you to change the translucency of the layer;
- Autorefresh Interval – Enables you to configure the refresh time for a layer in seconds;
Step: Heat Map (if enabled)
Scale Radius
| Yes | Zoom level affects the size of the heat map radius. |
| No | Zoom level does not affect the size of the heat map radius. |
Radius
The radius (in pixels) of the Heat Map brush.
Min Opacity
A numeric value that defines the minimum opacity of a heat point.
| Min | 0 |
| Max | 1.0 |
Max Opacity
A numeric value that defines the maximum opacity of a heat point.
| Min | 0 |
| Max | 1.0 |
Blur
A numeric value that adjusts how much a heat point is blurred.
| Min | 0 |
| Max | 1.0 |
Use Aggregation?
| Yes | Aggregate the values defined in the Intensity field to determine the heat of a point. |
| No | Heat is determined by marker density, not value. |
Intensity
(This option is displayed when “Use Aggregation?” is set to Yes.)
Choose a field to aggregate a value for heat.
Show Markers as Well
| Yes | Show the markers in addition to the heat map. |
| No | Hide the markers when the heat map is enabled. |
Step: Preview
Displays a preview of the Map.