The Pipeline is where you manage data in edgeCore. It is rare that raw data from a source comes into edgeCore ready to be visualized. The raw data often has to be transformed or filtered in order to make an effective visualization. edgeCore’s Data Pipeline provides a visual way to do this.
To open the Pipeline user interface, click ![]() .
.
Pipeline Nodes
The Data Pipeline is comprised of different colored objects called “nodes”. Each node has a color and icon associated with it, indicating the type of operation performed at that step. The following table details what the colors and icons represent:
| Icon | |
|---|---|
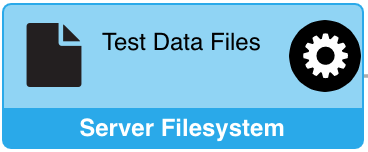
| Connection: This node represents a connection to a data source. It contains all the configuration information required to connect to that source and serves as a grouping mechanism for data sets in the system. The Connection type is reflected in the icon. | |
| Feed: This node represents an initial data set from the associated data source. The options available in a Feed’s configuration will vary based upon the type of data source you are working with. Example: A CSV Feed will have limited configuration, mainly for specifying a delimiter to use when parsing the file. A Database Feed allows for an initial SQL query. | |
| Transform: This node represents a structural change to the data, meaning the attributes (columns) in the resulting data set may differ from the parent node. A transform represents concepts such as GROUPBY, JOIN, or UNION. They also represent transforming flat tabular data into relational models. | |
| Filter: This node represents a data set where the records (rows) have been limited in some way. Filters leave the structure of the data intact, meaning the attribute names (columns) remain the same from parent to child. | |
| Visualization: This node represents the configuration required for specific visualizations. Data sets can have multiple visualizations defined, and the type of visualization is reflected in the icon. |
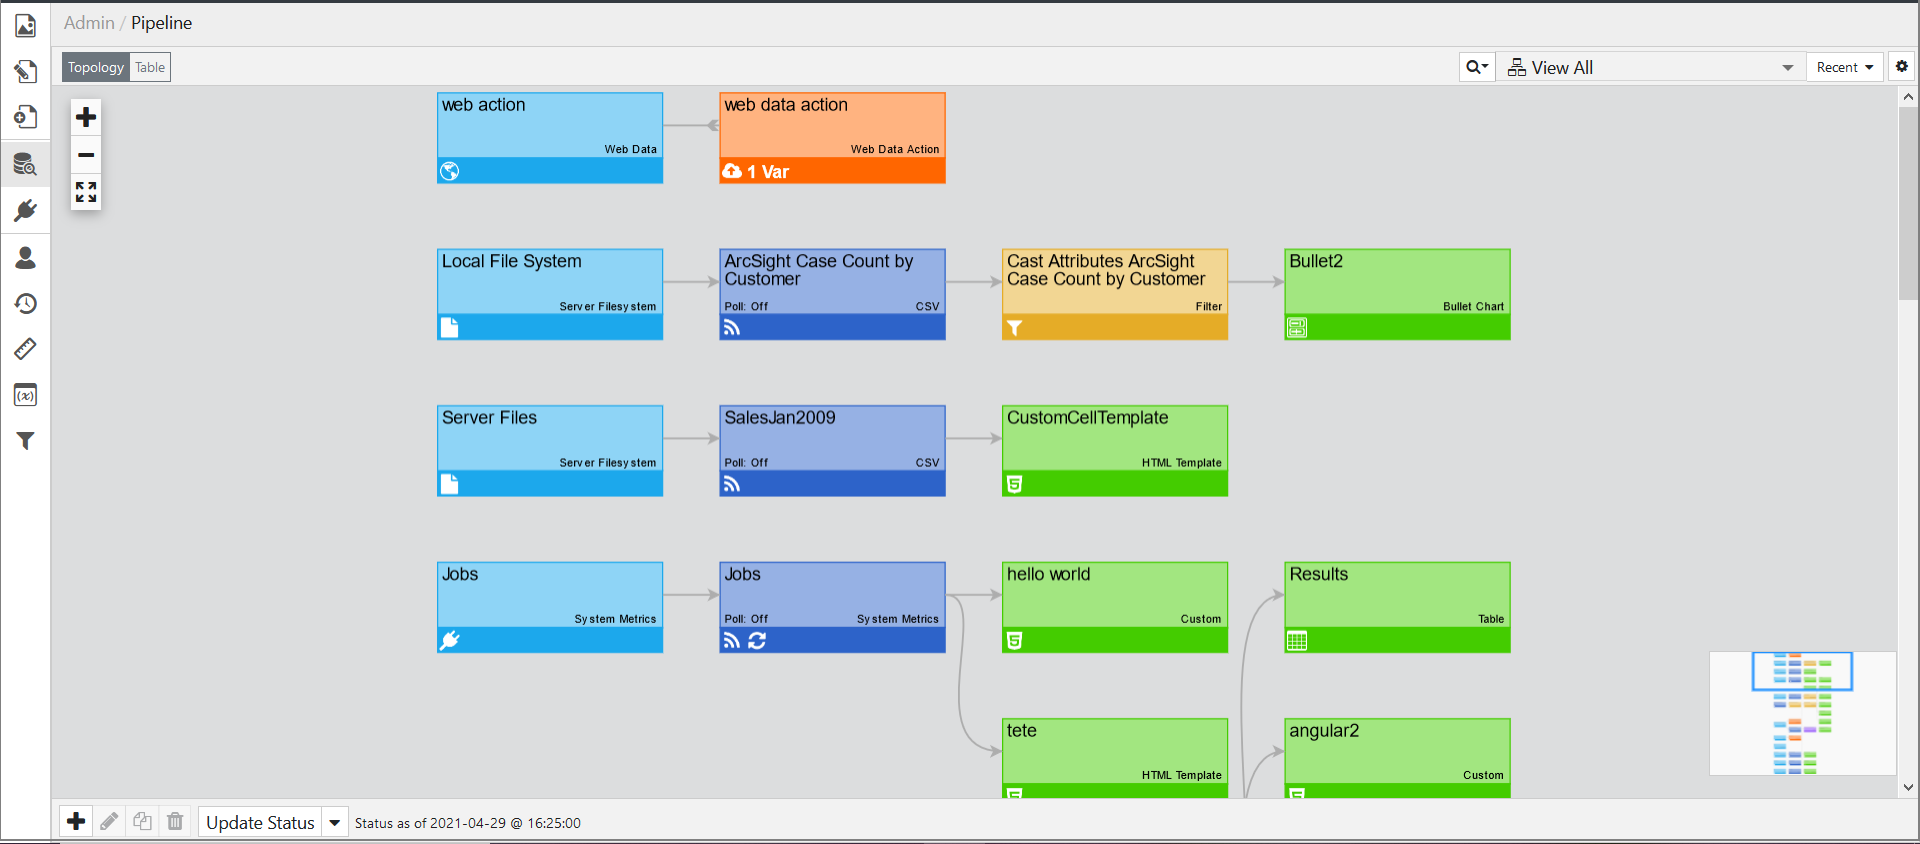
View Modes
The Pipeline can be viewed in two ways:
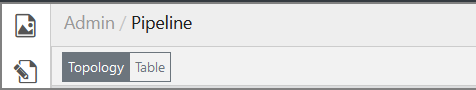
- Topology: A graphical hierarchy that starts with a Connection and ends with a Visualization.
- Table: A flat tabular view of the nodes in a system.
Filtering the Data Pipeline
The filter control is located in the header of the pipeline (top right).
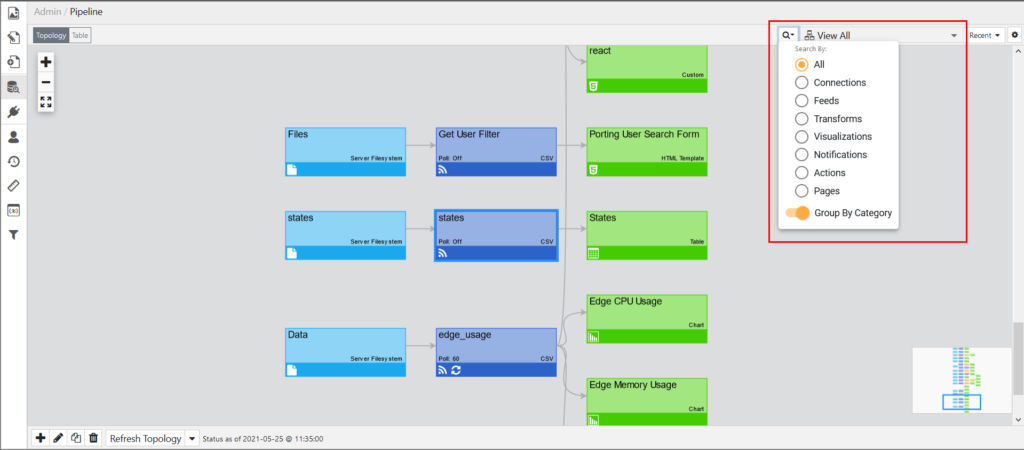
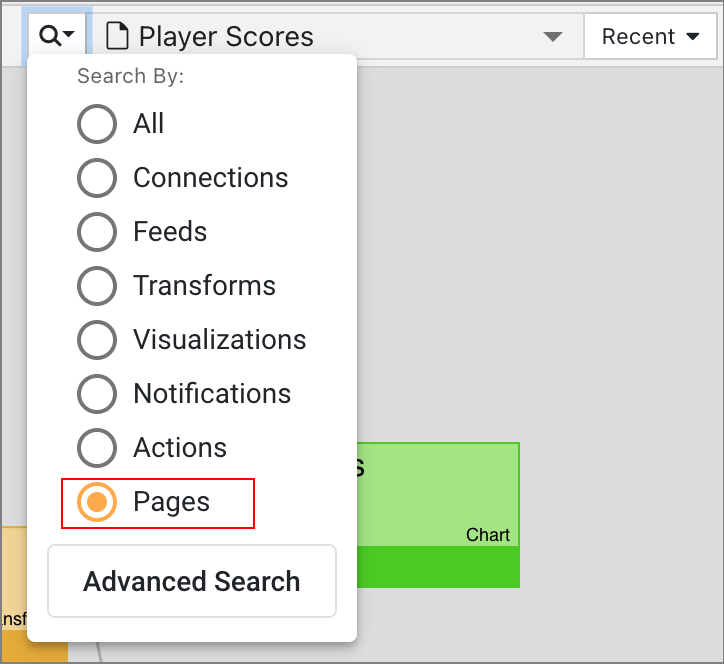
Filtering enables you to limit your search to:
- All (introduced in 4.3.7)
Allows you to search all node types. All is the default search and includes both the pipeline nodes and pages. - Connections
- Feeds
- Transforms
- Visualizations
- Notifications
- Actions
- Pages
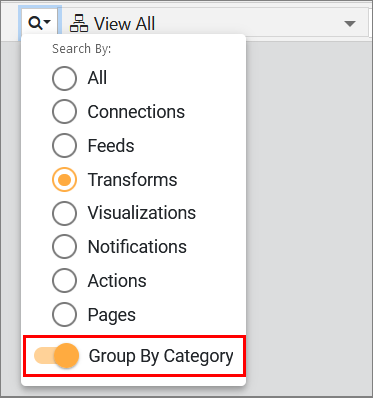
Group By Category
The Group By Category option enables you to constrain your search based on different categories of objects in the pipeline.
For example, we have filtered the pipeline by Transforms and enabled the Group By Category toggle switch. As a result, Transforms are grouped into categories such as Filter, JavaScript, SQL Transform, and Time Series and then displayed alphabetically within those categories. When the toggle is disabled, the results are displayed as a flat alphabetical list.
![]()
Pipeline Settings
Pipeline settings can be accessed using the  icon at the top right of the header.

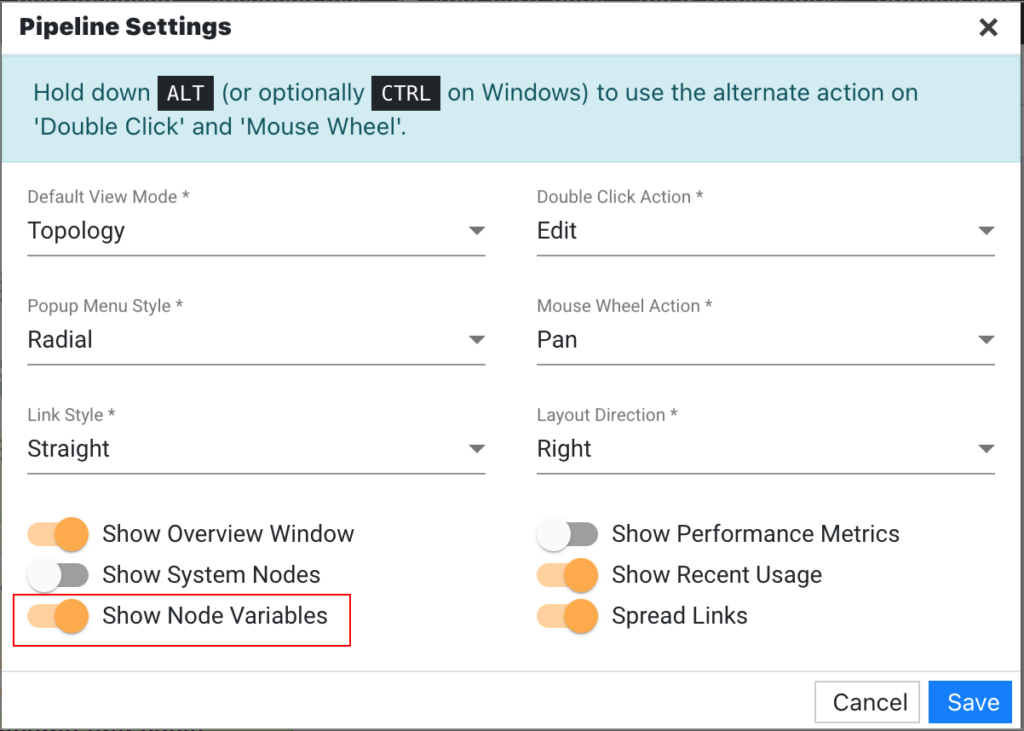
Available settings are as follows:
Default View Mode
Sets the default view mode for the pipeline:
- Topology – A graphical hierarchy that starts with a Connection and ends with a Visualization.
- Table – A flat tabular view of the nodes in a system.
Double Click Action
Sets the default behavior for a Double Click:
- Edit – Double-clicking a node will open the configuration for that node.
- Filter – Double-clicking a node will filter the view by that node.
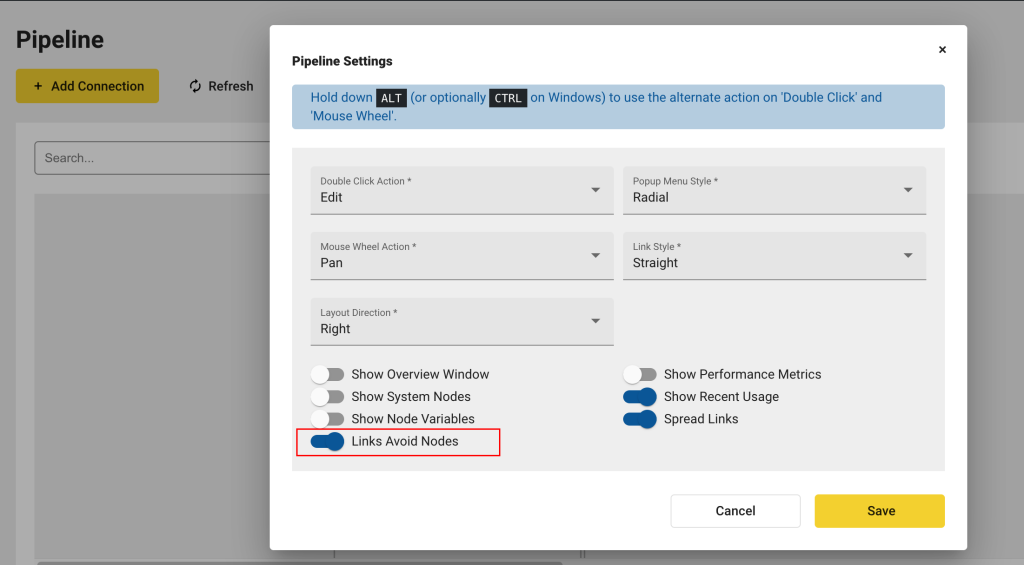
Hold down ALT (or optionally CTRL on Windows) while double-clicking to use the alternate of whatever action is defined here.
Popup Menu Style
Sets the style of the popup menu associated with nodes in the pipeline.
- Radial – A circular menu containing a list of actions.
- Vertical – A vertical menu containing a list of actions.
Mouse Wheel Action
Sets the style of the popup menu associated with nodes.
Hold down ALT (or optionally CTRL on Windows) while using the mouse wheel to use the alternate of whatever action is defined here.
- Pan – The mouse wheel will scroll vertically.
- Zoom – The mouse wheel will zoom in and out.
Link Style
Determines the style of the links connecting each node.
- Bezier – Connectors will use curved lines to help distinguish relationships.
- Orthogonal – Connectors will use right angles, along with a healthy corner radius to help distinguish relationships.
- Straight – Connectors will use straight lines to help distinguish relationships (introduced in version 4.4.1).
Layout Direction
Determines direction when in the topology view mode.
- Right – The relationships will flow from left to right.
- Down – The relationships will flow from top to bottom.
Show Overview Window
Determines whether a small overview appears in the bottom-right corner of the pipeline.
- Yes – The overview will appear at the bottom right.
- No – The overview will be hidden.
Show System Nodes
Determines whether two sources and three feeds that are built into the product (edgeSuite System Metrics and edgeSuite Job Status) are shown in the pipeline. (Introduced in version 4.1.0)
- Yes – System nodes will be displayed in the pipeline.
- No – System nodes will not be displayed.
Show Node Variables
Determines whether used node variables are expanded in the pipeline. (Introduced in version 4.4.1)
- Yes – Used node variables will be expanded in the pipeline.
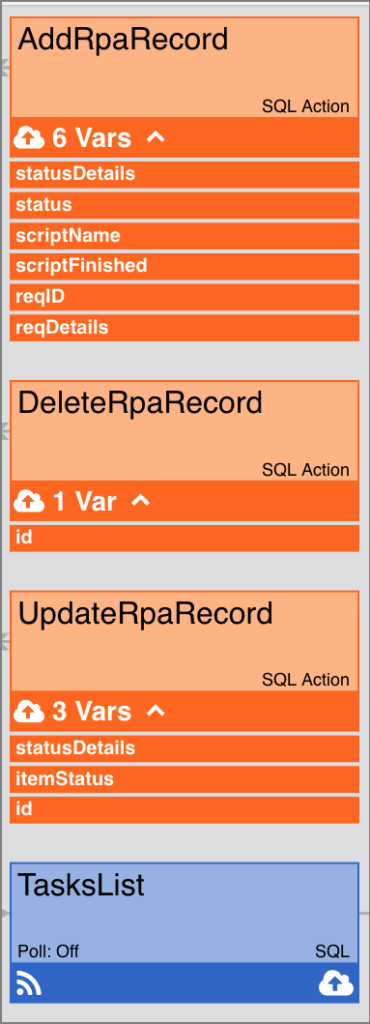
- No – Used node variables will not be expanded, but you can manually expand them by clicking the arrow next to the number of variables.
Show Performance Metrics
Determines whether metrics related to the memory and resource utilization at a node level will be shown.
- Yes – The performance metrics will be displayed in the tooltips of the nodes and inside the Table view.
- No – The metrics will not be displayed.
Show Recent Usage
Determines whether the Recent dropdown will be shown. This dropdown is used to view what nodes you recently worked with. (Introduced in version 4.3.1)
- Yes – The Recent dropdown will be displayed in the pipeline.
- No – The Recent dropdown will not be displayed.
Spread Links
Determines the starting point for each node link/line. (Introduced in version 4.4.1)
- Yes – The starting point for each node link/line is different (each node has its own starting point)
- No – Node links/lines start from the same place
Pipeline Actions
Base Pipeline actions are located in the footer (bottom left).
![]()
| Icon | |
|---|---|
| Add Connection: This action will add a new Connection to the Data Pipeline. Connections act like “root nodes” in the data pipeline, and they typically appear at the far left of the display. See the “Adding a Node” section below. | |
| Edit Selected: The action will launch configuration for the selected node, allowing the administrator to make changes. You can also double-click a node in the Data Pipeline to Edit. | |
| Clone: This will create a clone of a selected pipeline node. The user will be prompted to enter a suffix to ensure the new node is distinct. After cloning a node, it can be reparented to a different location in the pipeline. | |
| Delete Selected: This action will delete a selected node. See the “Deleting a Node” section below. | |
| Update Status: By clicking the arrow, you will be presented with two options: to update the status of the pipeline and to refresh the topology. |
Adding a Node
To add a new node to the data pipeline, mouse over a node. If a node has available actions, then a gear icon will appear.
Clicking the gear will expose the available actions in a radial menu. The actions that are available will vary based on context. For example, you cannot re-parent a Connection, and Connections do not have any associated jobs, so those options are disabled for a Connection node.
To add a node, click the ![]() icon.
icon.
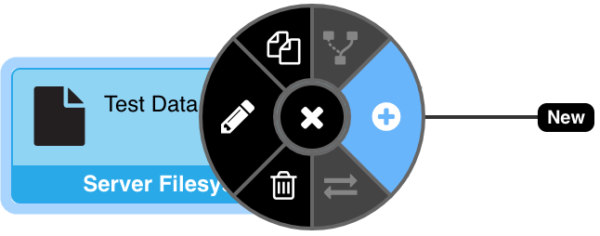
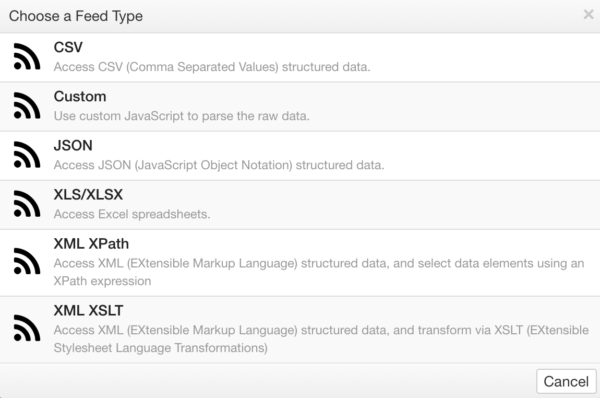
This will display a context menu of valid node types to choose from. In the case shown above, it is a Filesystem Connection, so the user will select from a list of relevant feed types:
Deleting a Node
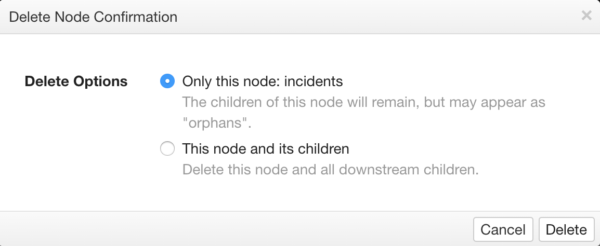
When deleting a node that has children, the system will prompt the user with two options:
-
-
- Only Node – This option will delete the selected node, but it will leave all child nodes. The remaining child nodes will be considered orphans.
Orphaned nodes will lose their association to a valid data source. This means that all Visualizations associated with these orphaned nodes will be broken. Orphaned nodes can be reparented to another data source; however, this may require modifying configuration to reference new or different attribute names. - The Node and its children – This option will delete the selected node and all of its children.
- Only Node – This option will delete the selected node, but it will leave all child nodes. The remaining child nodes will be considered orphans.
-
Node Status
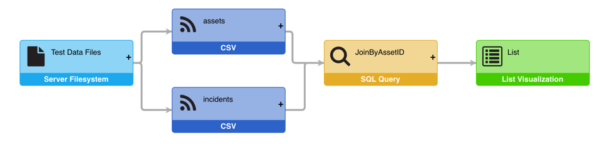
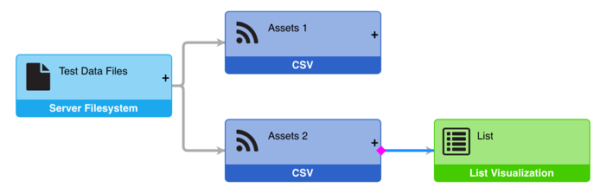
In the example below, two CSV Feeds are shown – “assets” and “incidents”. These Feeds result in two distinct data sets: one with a list of assets and one with a list of incidents. In order to show the health of the assets in a List Visualization, you first have to join those two data sets together, as shown below.
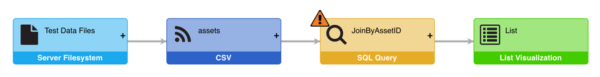
Now assume that you delete one of these feeds. The missing data set would create a problem for the JOIN node, and ultimately the List Visualization. In the example below, the “incidents” feed has been removed, and the Data Pipeline is indicating a problem with the “JoinByAssetID” SQL Query.
If you edit that JOIN transform and take a look at the query, you will see that there is another layer of status indication in the queries themselves. Since you deleted the “incidents” feed, the references to that missing data set are highlighted with red boxes.
Reparenting Nodes
It is possible to reparent nodes in the Data Pipeline. The Data Pipeline uses a drag and drop gesture for this operation.
-
-
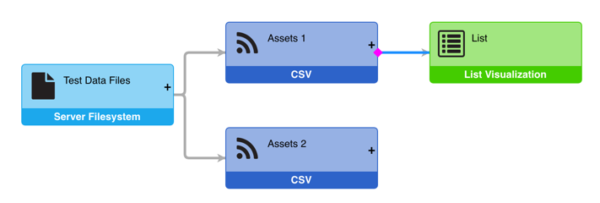
- Select the link between two nodes: This causes the link to highlight, and a magenta diamond to appear.
-
-
-
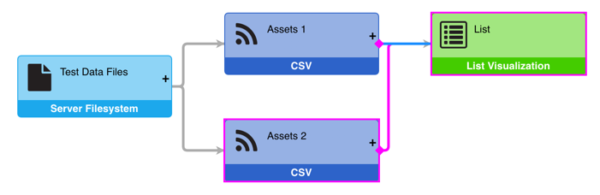
- Drag the diamond to a new parent
-
-
-
- Drop the diamond on the new parent
-
Reparenting between different datasets can cause problems.
Transform, Filter, and Visualization configurations often reference explicit attribute names. So, when reparenting, it is possible that the attribute names in the old data could have different names in the new data set.
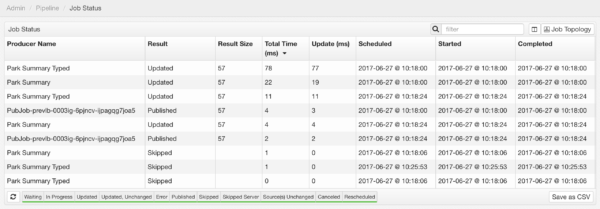
Job Status
In order to better diagnose pipeline problems, metrics from running jobs in the pipeline are collected and reported in the Job Status user interface.
Metrics:
-
-
- Start time and end time for each job’s task
- Time spent in preparation to run the update, time performing the update, and time running cleanup
- Name of the producer for the job
- Key for the job’s task (includes all nodeVars and secVars that apply to the job)
- Trigger, if known (like client subscription)
- Result of the update (success, server error, etc.)
- Size of the results (number of rows)
-
Reporting:
-
-
- All publish Jobs
- All publish Jobs for a session
- All active tasks
- Last completed task for all active jobs
- All tasks in last X seconds
- Last task for all jobs required by a session publish Jobs
-
The administrator can filter which types of job Results (rows) are displayed in the grid by clicking individual labels in the bottom section to toggle each type of job on or off. Initially, all types of jobs are shown in the display.
The administrator can filter which information is displayed about each job (columns) by clicking the “Toggle Column Visibility” button in the upper-right, and then checking the boxes for the desired columns to display.
Remote Pipeline
To learn how to set up a remote pipeline, refer to this page.
Recently Viewed Nodes
edgeCore version 4.3.1
To view what nodes you recently worked with, click Recent.
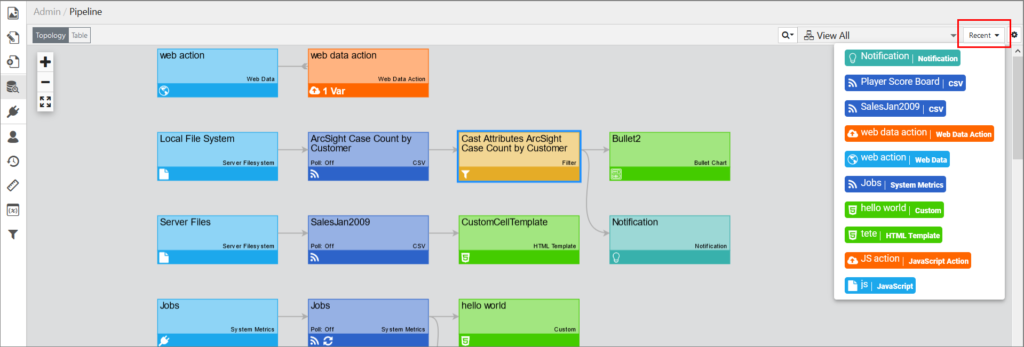
If you do not want to see the Recent dropdown, you can disable it in the Pipeline settings (the gear icon next to it) by turning off the toggle switch.
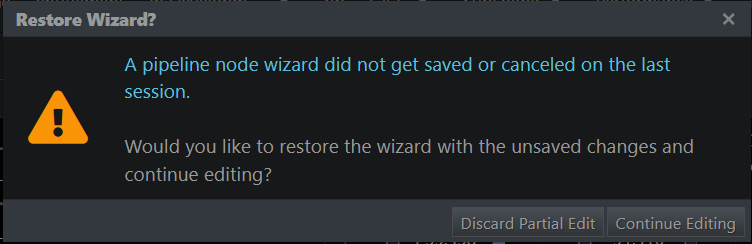
Pipeline Node State Preserved on Lost Session
edgeCore version 4.3.6
The state of partially configured pipeline nodes is preserved on session expiration so that you do not lose work.
If a session expires while you are working on a pipeline node (for example, you are creating a new node or editing an existing one), you will be able to resume the wizard with all the settings you had once you log back in.
Dataset Preview Limit in the Pipeline Node Editor
edgeCore version 4.3.9
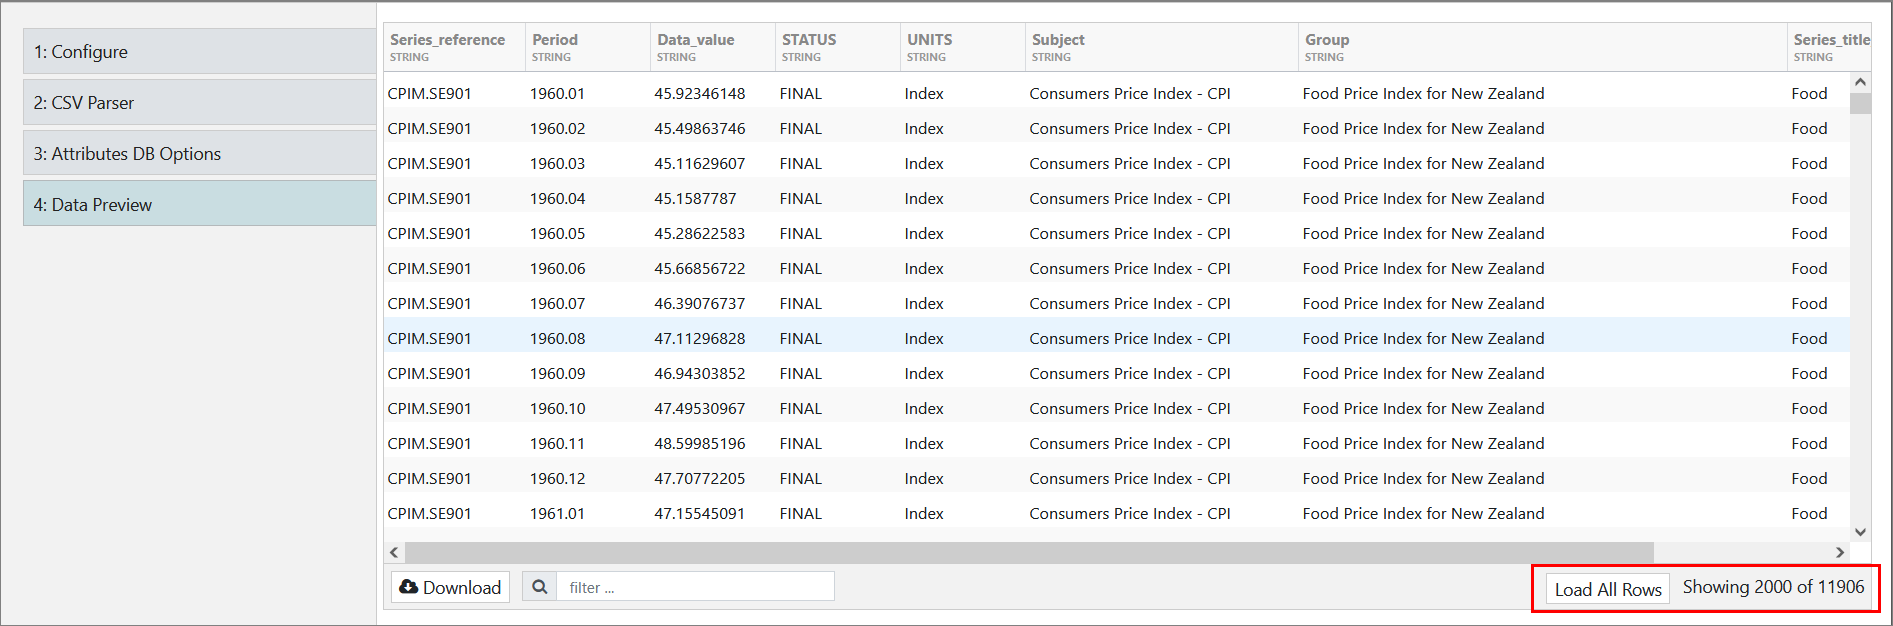
By default, the limit is 2000 rows. If the dataset has more than 2000 (or configured limit) rows, the server will limit it and add a button to the preview table, enabling you to retrieve all rows if wanted.
The limit can also be configured in local.properties by entering the following:
client.datapreview.limit=x
Navigating to and Viewing the Pipeline for a Specific Page
edgeCore version 4.3.10
In the Edit page mode, the admin user can navigate to and view the pipeline for that particular page by clicking the pipeline icon in the upper-left corner.
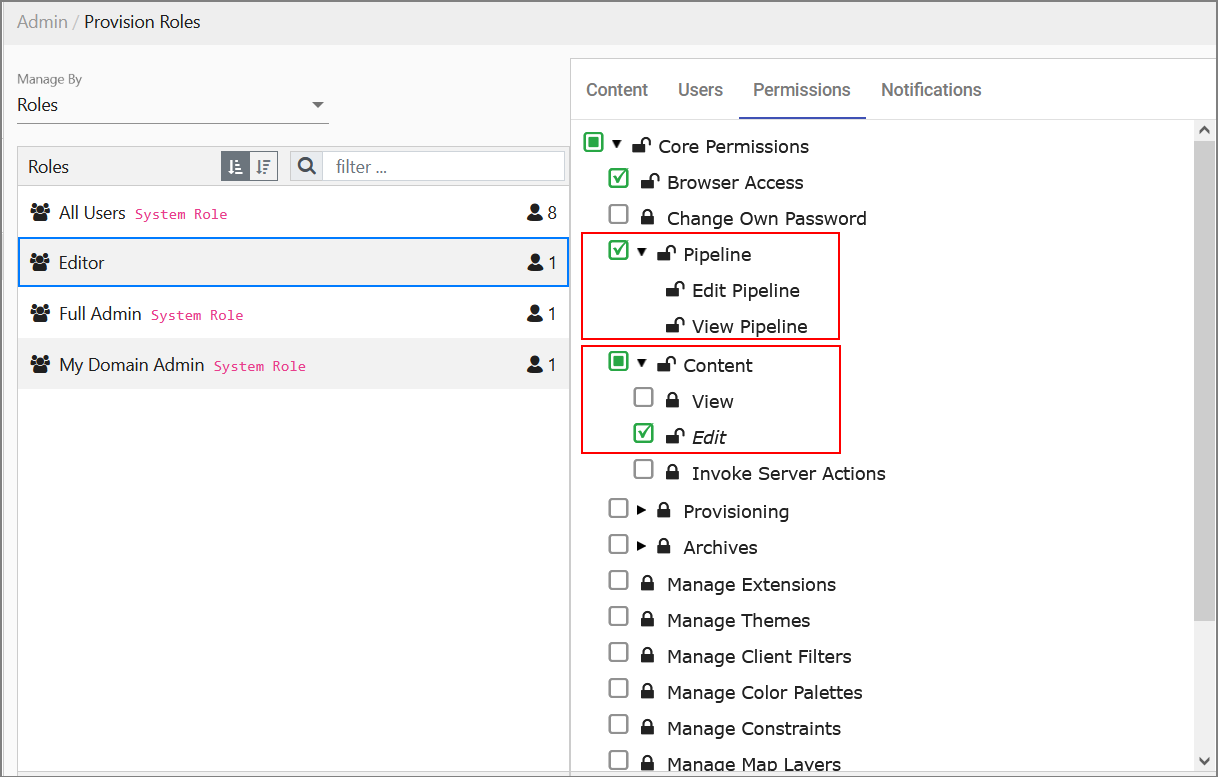
If you want a custom role to be able to navigate to the pipeline for the page they are editing, you will need to provision content and also grant them the following permissions in Provision Roles: the full Pipeline permission and the Edit Content permission.
Newly Created Connection Highlighted
edgeCore version: 4.3.11
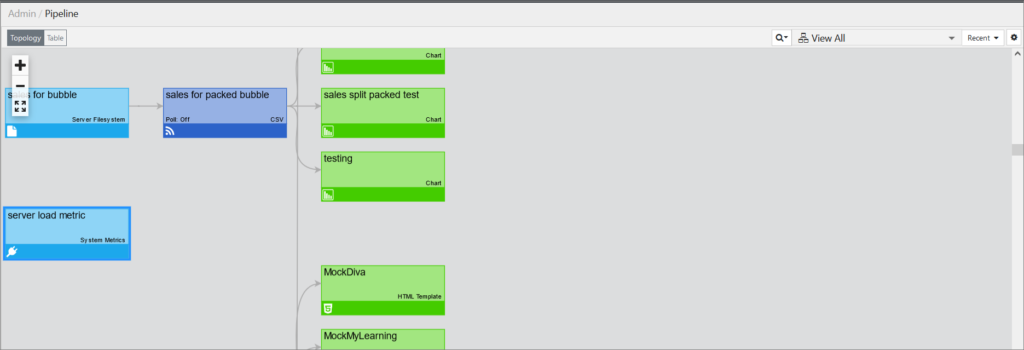
When you are in the pipeline and the View All filter is applied, upon adding a new connection, the newly created connection is highlighted, and you are taken to that part of the pipeline where the connection is located (as seen in the screenshot below with the server load metric connection).
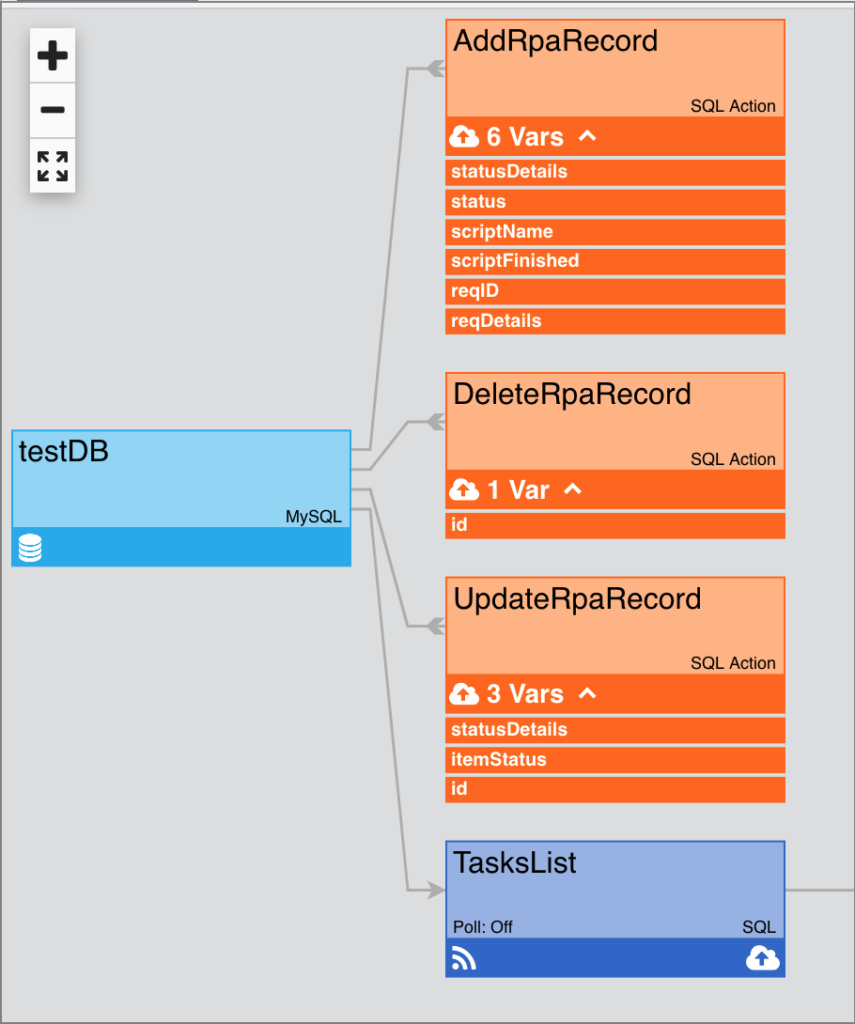
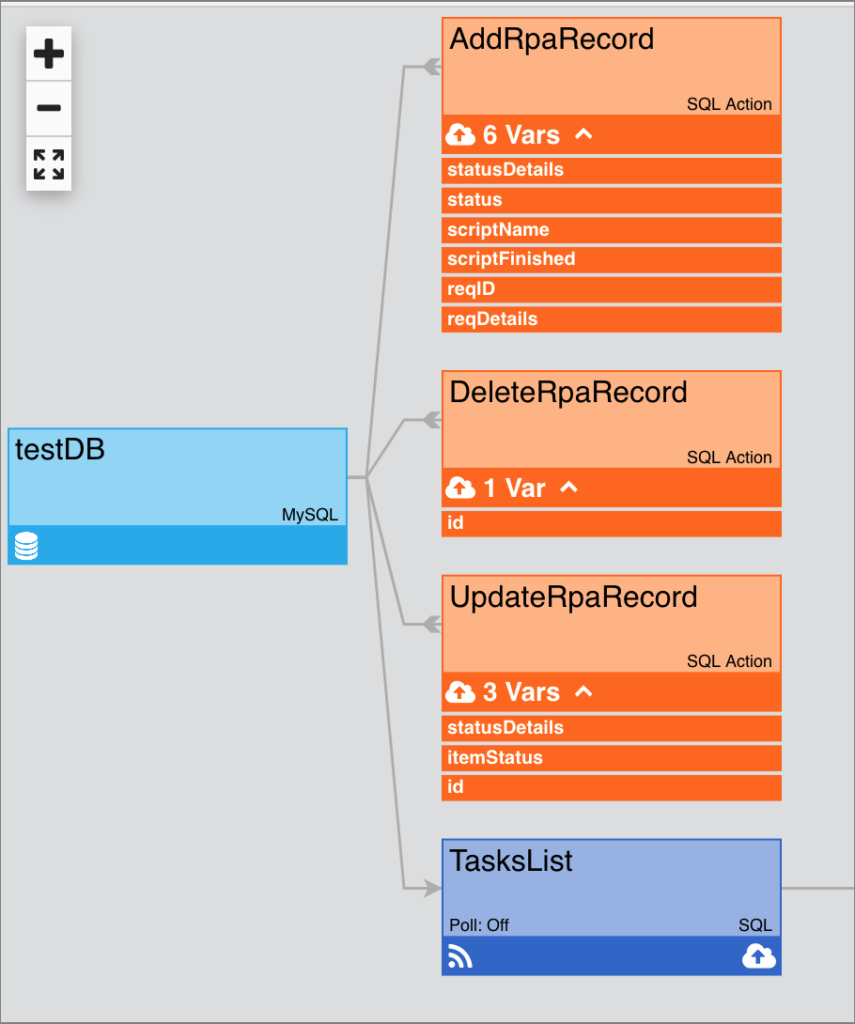
Showing Used Node Variables in the Pipeline
edgeCore version: 4.4.1
To expand node variables, click the arrow next to the number of variables:
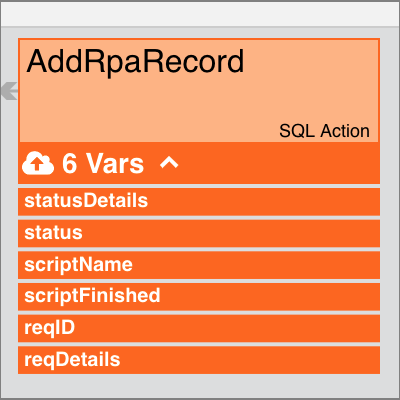
Alternatively, you can enable the Show Node Variables toggle switch in the Pipeline Settings, and the used node variables will be expanded.
Viewing Pages in Recent
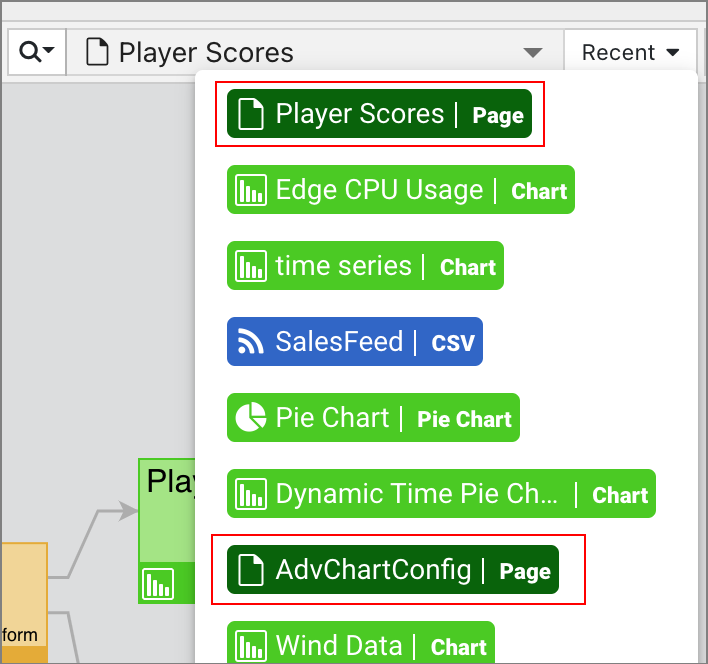
edgeCore version: 4.4.1
When you filter the pipeline by pages, those pages will be listed in the Recent dropdown.
Recent Pipelines Accessible from Admin Menu
edgeCore version: 4.6.1
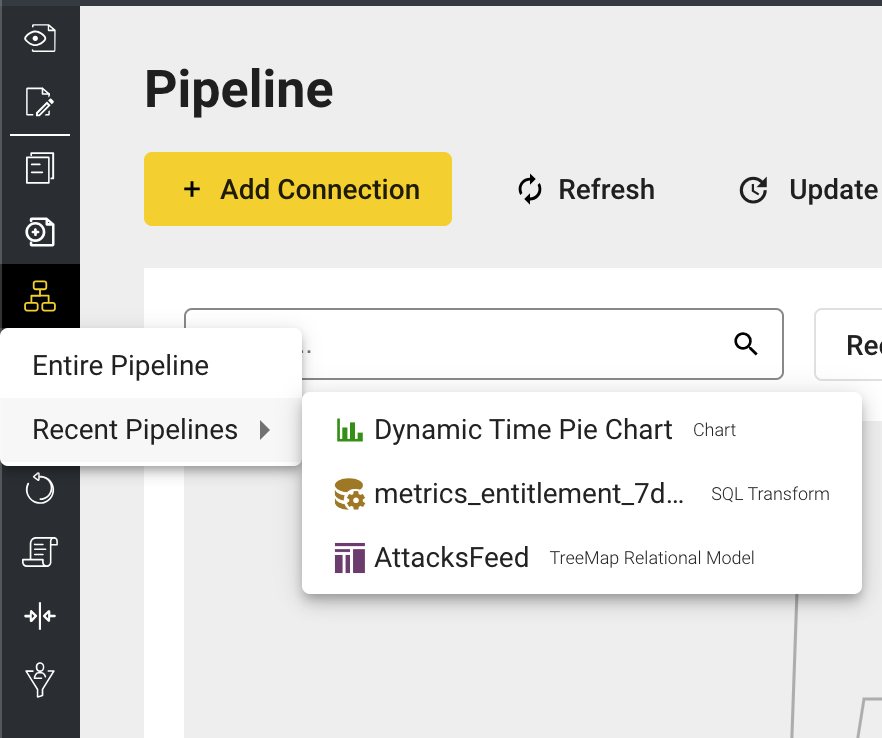
To navigate to pipelines you have recently worked on, click on Pipeline in the admin menu and go to Recent Pipelines.
Links Avoiding Nodes on Render
edgeCore version: 4.6.2
In Pipeline Settings, the option that renders links as avoiding nodes is enabled by default.