Here you will do the following:
- Transform data elements and present them in a new format
- See how Angular provides for HTML attribute customization
In this exercise, you are going to create a simple summary that lists each state and then shows the total number of parks in that state. It uses custom formatting not provided in any of edgeCore’s stock Visualizations. It also creates labels (the state names) based on data values, rather than the previous examples where labels are typically tied to columns (attributes). This sort of presentation can be accomplished with a basic knowledge of Angular and how data can be processed in an HTML Template Visualization.
Group and Sort the Data
You will create SQL Transform that will group and sort parks by state and count how many parks there are in each state. This is the data that we will feed into the visualization.
Perform the following steps to create a Transform from the previously created National Park Summary CSV Feed:
- Click the gear icon button in the National Park Summary CSV Feed box, select New (+), and then select New Transform.
- Select SQL Transform.
A new page is displayed. - In Configure, do the following:
a) In Transform Name, provide a name (for example, Group By State).
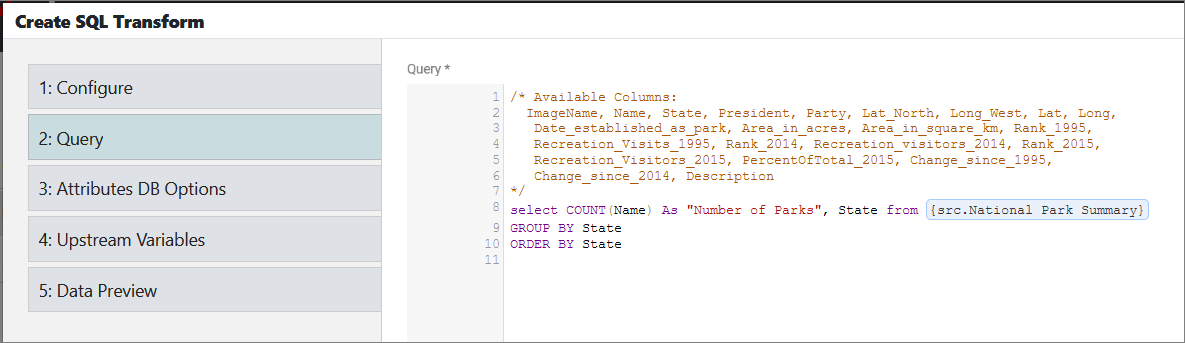
b) Click Next. - In Query, paste the following:
select COUNT(Name) As “Number of Parks”, State from {src.National Park Summary}
GROUP BY State
ORDER BY State
- Click Next.
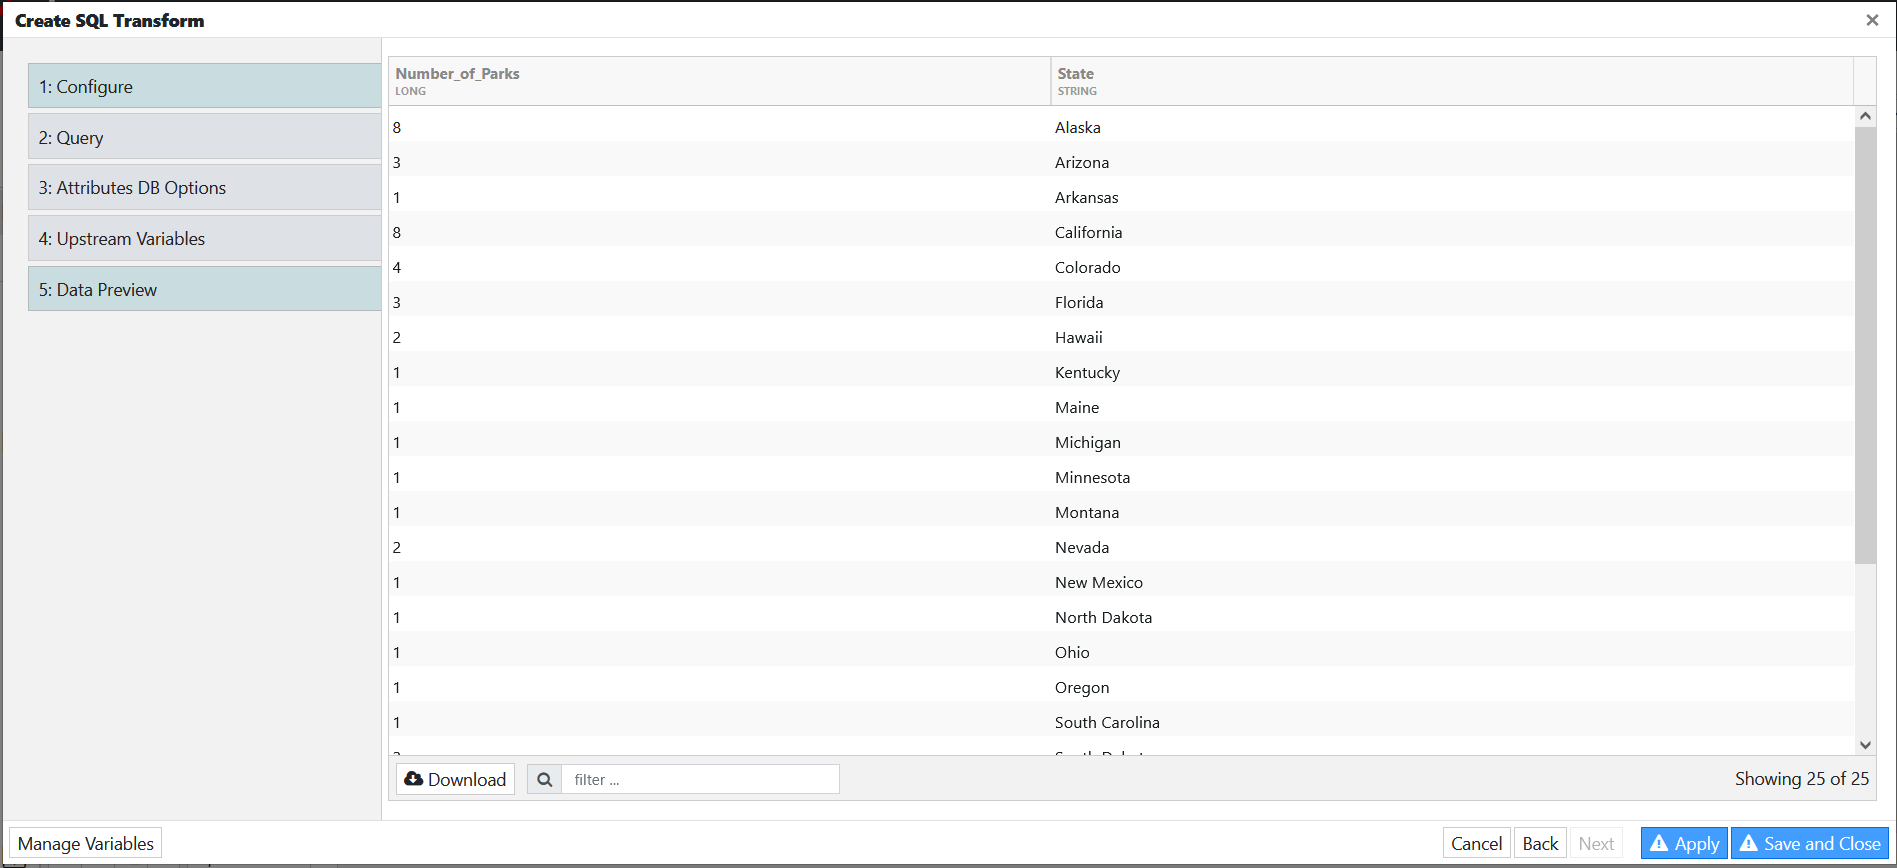
No changes are needed in Attributes DB Options or Upstream Variables, so click Next to go to Data Preview. Here you can observe the data preview of the Group By State Transform.
- Click Save and Close.
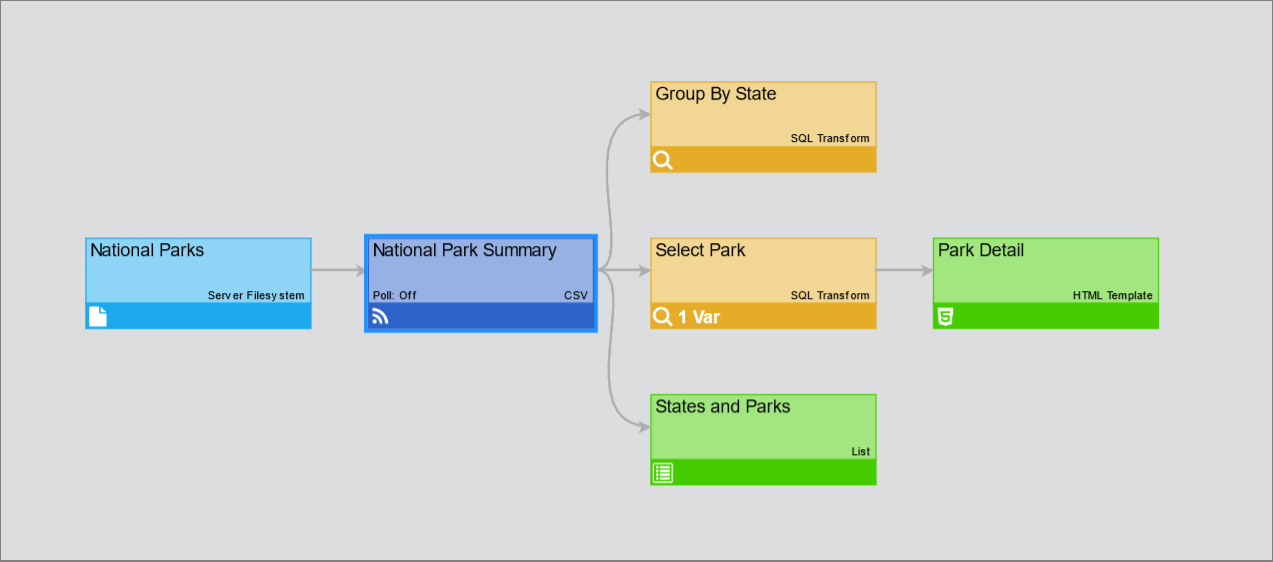
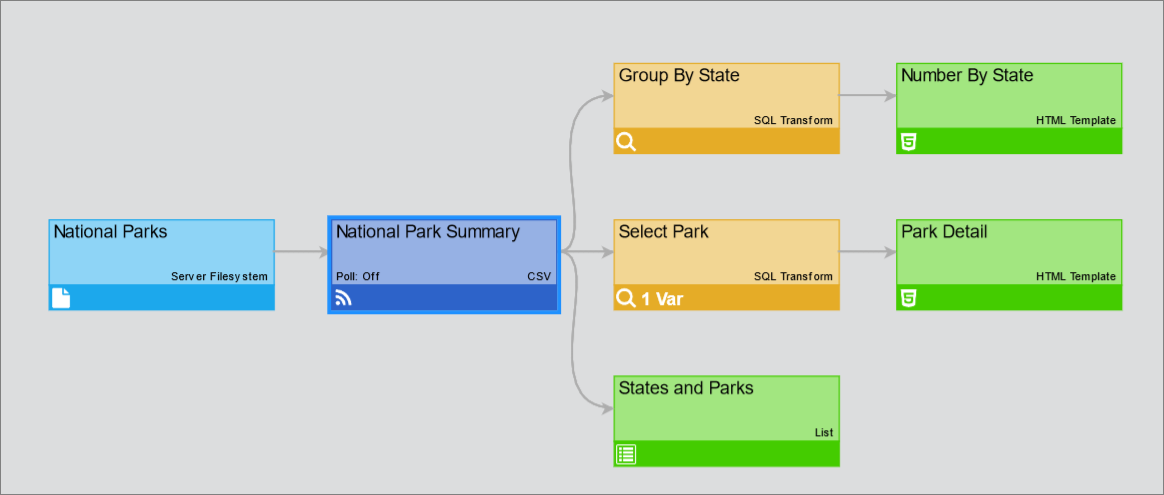
The created transform is displayed in the pipeline.
Create an HTML Template Visualization
You will create an HTML Template Visualization that will list each state and show the total number of parks in that state with custom formatting.
Perform the following steps to create an HTML Template Visualization:
- Off of the Group By State SQL Transform, create an HTML Template visualization.
- In the Configure tab, in Name, provide a name (for example, Number By State).
- In the Renderer tab, do the following:
a) In HTML, enter the following code:<div *ngFor="let row of rows"> <div class="itemOuterDiv"> <div class="itemLabel">{{row.State}}</div> <div class="itemValue">{{row.Number_of_Parks}}</div> </div> </div>b) In LESS/CSS, enter the following:
.itemOuterDiv { width: 100%; height: 100%; padding: 10px; } .itemLabel { font-size: 1.2em; color: #999; height: 20px; vertical-align: bottom; border-bottom: 1px solid #ddd; padding-left: 3px; } .itemValue { min-height: 30px; vertical-align: top; margin: 0 0 20px 3px; overflow-wrap: break-word; } overflow:scroll; - Go to Preview, where you can observe the HTML component showing a label (State) and a value (Number_of_Parks).
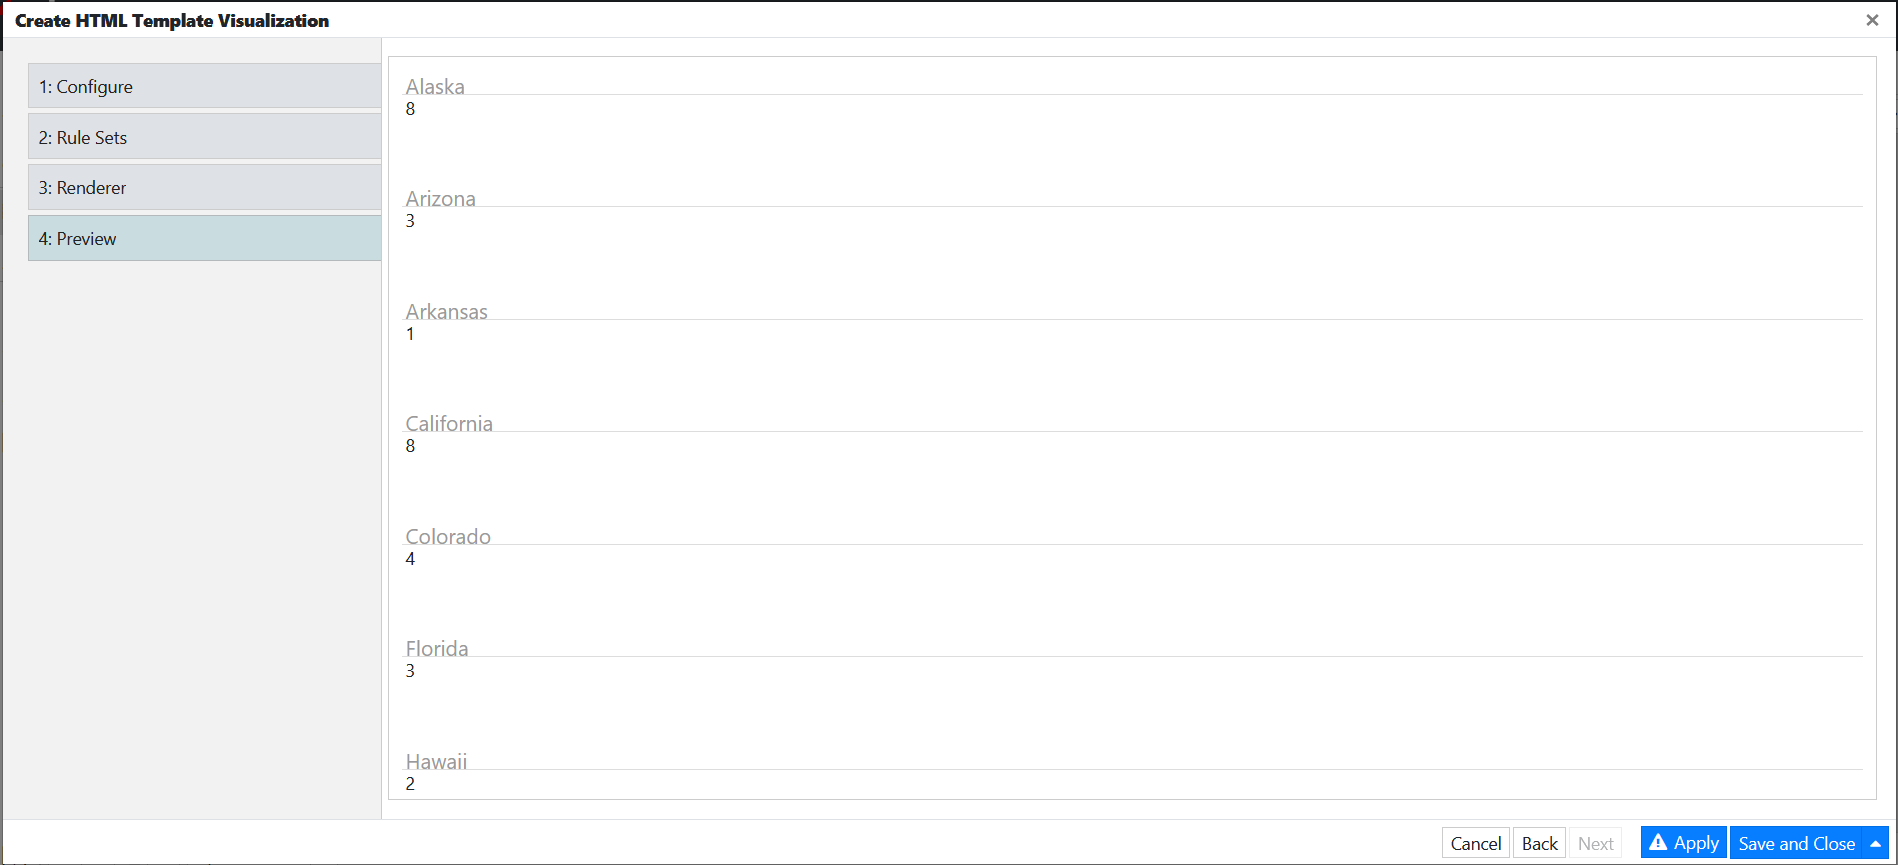
- Click Save and Close.
The pipeline looks like this now:
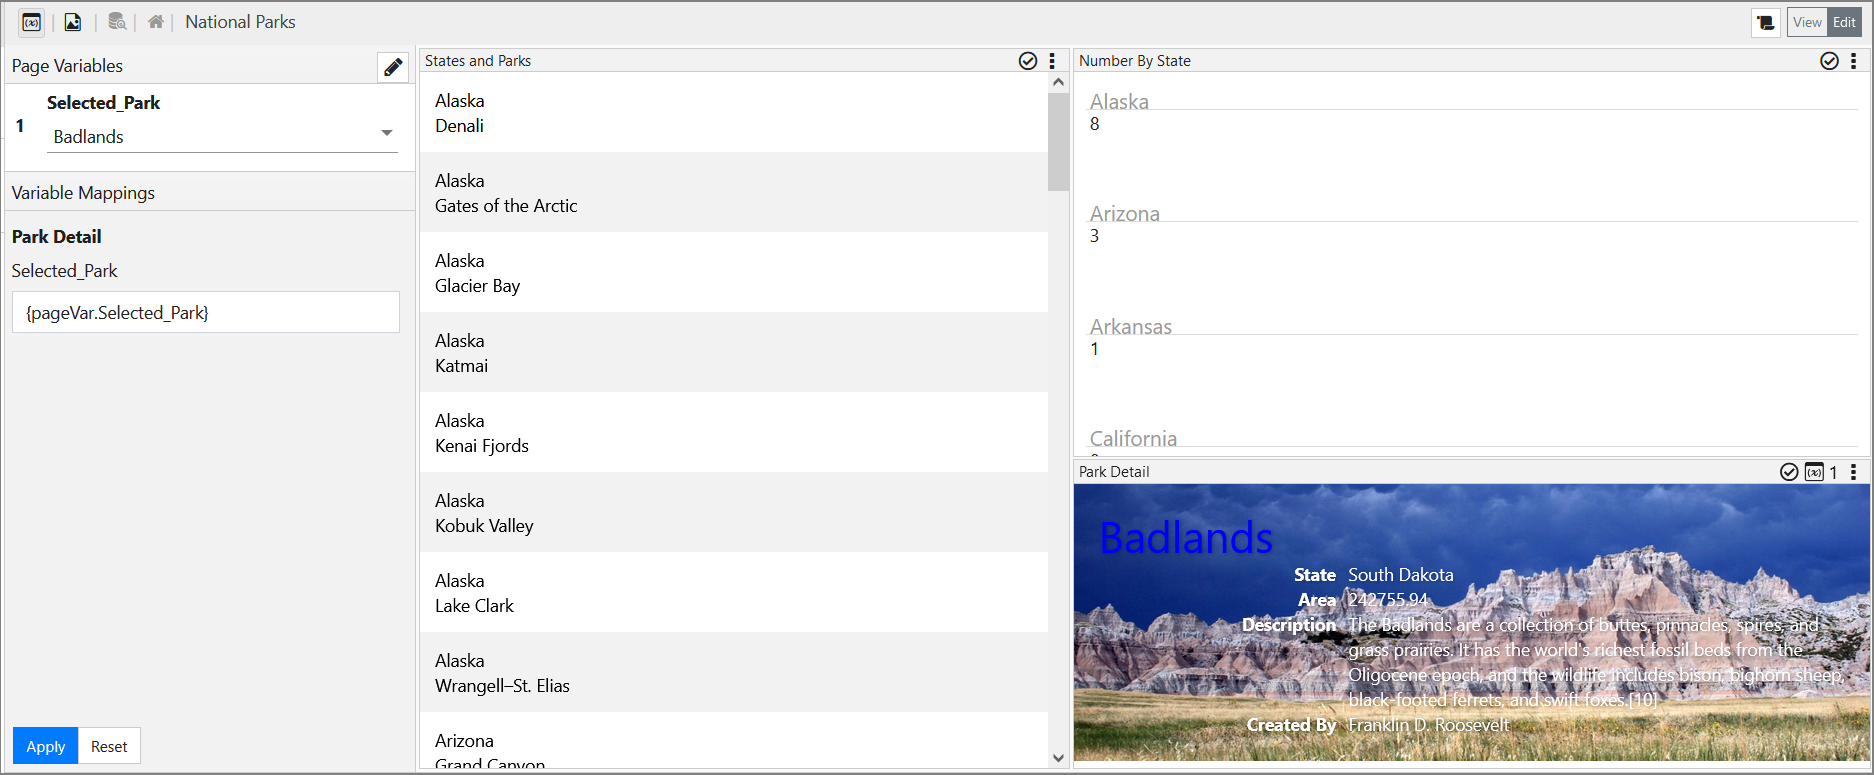
- Add the created HTML visualization to the National Parks page. Place it wherever you see fit and save the page.
Exercise Summary
You have created a query to transform an existing dataset into a new one. Then you created an HTML Template Visualization that used a special call to Angular to show two attributes in a presentation with custom formatting.