Overview
A TreeMap Relational Model transform produces a data structure that can be used by a TreeMap Visualization. The important concept behind a TreeMap Relational Model is that it builds up a hierarchical dataset based on node information. This differs from a Flow Relational Model, which builds its model from link information.
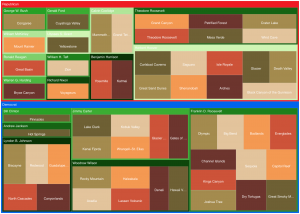
TreeMap Visualizations will display the hierarchical data structure shown above as a set of nested rectangles (TreeMap), or concentric circles (Sunburst). Each branch is represented by a rectangle (TreeMap), or section of the circle (Sunburst). Sub-branches and leaf nodes are shown as smaller rectangles tiled inside of their parent (TreeMap), or as outward radial extensions (Sunburst).
Create a TreeMap Relational Model Transform
- Mouse over the right side of the node and click the gear icon for the node.
- Click the New icon.
- Select the “New Transform” option.
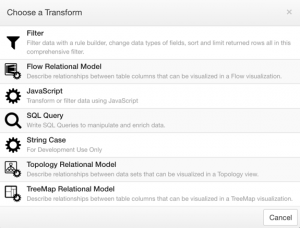
The “Choose a Transform” dialog will appear, showing the available transforms in the system. Select the “TreeMap Relational Model” option. This will launch the TreeMap Relational Model Wizard:
TreeMap Relational Model Wizard
Step 1: Configure
| Property | Description |
|---|---|
| Transform Name | A symbolic name used to represent this transform. This is the name that will show up the in the pipeline node representing this transform. |
| Description | This is where the administrator can enter notes for the transform. |
Step 2: Tree Map Levels
This step defines the relationship between attributes within the dataset that will appear in the final Visualization. In the Example below, the attributes will be show using the following hierarchy: Political Party → President → Park Name.
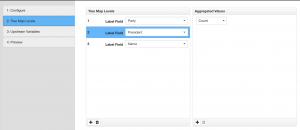
For each level, you must supply at least one aggregated value definition for the TreeMap visualization to use on determining the size of each piece. You can define more than one, which is useful when using color rules for the pieces.
Important Note: The Aggregated Values panel updates as you select the TreeMap Levels on the left. That is, the right side is context-sensitive to the level and you can define different aggregated values for each tree map level.
| Property | Description |
|---|---|
| Label Field | For each level you can choose one field to be the Labels. Then you must configure at least one numeric Aggregated Value for the size calculations. |
| Aggregated Values | On this panel you must define at least one numeric aggregated value to be used for the Tree Map area size. You can define more than one, which can be useful for wiring up to color rules and usage in actions. The aggregate types are defined below: 1. Count Returns the total number of rows in the data. This numeric value can be used for the Size of the TreeMap node in the visualization configuration. 2. Sum When choosing a String data type, it will concatenate all the strings that are encountered and will separate the values with an optional separator. Concatenating strings can only be used in visualization actions and rule sets, and serves no purpose in the sizing of TreeMap nodes. When choosing a Numeric data type, the Sum aggregation algorithm will total (summate) all the numeric values. This numeric value can be used for the Size of the TreeMap node in the visualization configuration. 3. Max When choosing a String data type, the aggregation algorithm will return the string that is the last string in descending alphabetical order. When choosing a Numeric data type, it will find and return the maximum numeric value in the data. This numeric value can be used for the Size of the TreeMap node in the visualization configuration. 4. Min When choosing a String data type, the aggregation algorithm will return the string in ascending alphabetical order. When choosing a Numeric data type, the aggregation algorithm will find and return the minimum value in the data. This numeric value can be used for the Size of the TreeMap node in the visualization configuration. 5. First Returns the first non null or empty value. Can be a number or string. Numeric values can be used for the Size of the TreeMap node in the visualization configuration. |
Step 3: Upstream Variables
Details about this step can found here: Satisfy Upstream Node Variables Wizard Step.
Step 4: Preview