The Topology Visualization is available off of a Topology Relational Model. It allows you to display relationships between data with nodes and links. If geo-location data is available, it can place nodes on a Map as well. It supports six layouts:
- Standard
- Structural
- Lens
- Radial
- Hierarchical
- Custom (see Topology#Save Custom Layouts for more information)
Each dataset that is in the Relational Model can have a custom renderer defined. The renderers determine colors and icons displayed in each of the nodes, as determined by rules.

Tip: Double clicking on a Topology Visualization will zoom in.
Topology Configuration
- Configure
Base configuration options for the Topology. - Topology#Map Options (visible when Allow Map View is
Yes)
Provides options specific to the map view of topology. - Topology#Layout Options
Provides options for node layout, as well as animated transitions. - Topology#Node Renderers
Determines how data from each of the configured data sets should appear. - Topology#Link Renderers
Dynamically or statically style how links are rendered in the topology. - Preview
Previews the end result.
Step 1: Configure
Name
A symbolic name used to represent this Visualization. This is the name that will show up in choosers when adding a Visualization to a Page.
Use WebGL
| Yes | Use WebGL when the browser supports it, otherwise default to HTML 5 Canvas. |
| No | Only use a HTML 5 Canvas. |
Show Sidebar Buttons
| Yes | Show the sidebar button controls. (Zoom in, Zoom out, Fit to View, etc.) |
| No | Hide the sidebar button controls. |
Allow Map View
| Yes | Enable the ability to switch into a map view of your topology. Choosing this option requires you to provide a latitude and longitude field on all of your node renderer configurations. Also, choosing Yes will add a “Map Options” step to the Map Visualization configuration wizard. |
| No | Do not allow the user to switch the topology into map mode, or your data does not support it. |
Show All Nodes
| Yes | All nodes returned from the pipeline are rendered. |
| No | Only show nodes approved by the administrator. |
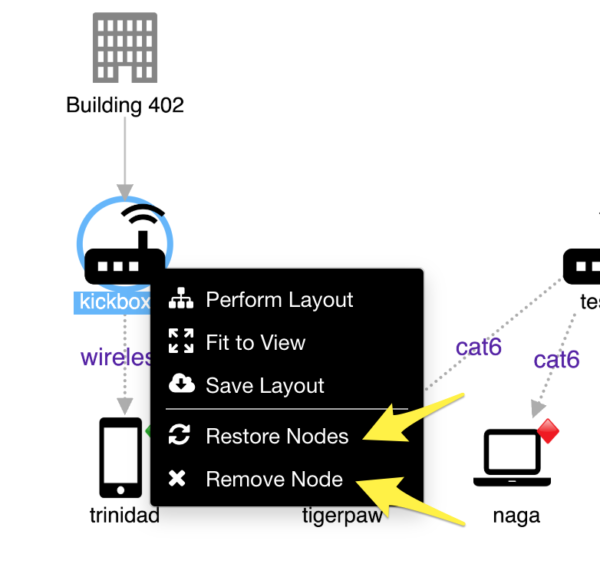
New options appear on the context menu when “Show All Nodes” is set to NO, and the topology is being viewed while editing a page.
Show Overview Window
| Yes | Show overview window. |
| No | Do not show overview window. |
Overview Window Placement
Choose where to place Overview Window
★ Note: This option will only appear if Use WebGL is set to No
| NE | Overview will appear in the North Eastern corner (Top, Right) |
| NW | Overview will appear in the North Western corner (Top, Left) |
| SE | Overview will appear in the South Eastern corner (Bottom, Right) |
| SW | Overview will appear in the South Western corner (Bottom, Left) |
Links Avoid Labels
| Yes | The topology layout engine will route links around node labels when possible. This can slow down the performance of the layout engine. |
| No | For added performance, the layout engine will not try to route links around node labels. |
Link Spacing
Choose how close link ends are rendered to their end-points
| Loose | Links are spread apart when connecting to a node. |
| Tight | Links are close (if not on top of each other) when connecting to a node. |
Step 2: Map Options
(only visible when Allow Map View is Yes)
Show Map on Startup
| Yes | The initial rendering of the topology will be placed on a map. |
| No | The initial rendering of the topology will use a layout. The user can then click the toggle button to place the topology on a map. |
Tile Provider
Pick one of seven map tile providers: Map Tiles and Overlays
Step 3: Layout Options
Layout Type
Choose the initial layout to use on the first rendering of the topology. You can choose from six options:
- Hierarchical: Tree-like layout that works best with data that is actually hierarchical in nature.
- Lens: Layout that places the nodes in a circle-like grid, with connected nodes next to each other.
- Radial: Layout that places nodes in concentric circles.
- Standard: An efficient force-directed layout that uses node repulsion and link elasticity to position nodes.
- Structural: Layout that places nodes which are structurally similar together in the network.
- Custom: Restores a hand-modified layout of the nodes (see Topology#Save Custom Layouts for more information).
The user will also have the option to select any of the above layouts at runtime, unless the “Show Sidebar Buttons” option is disabled above on the Configure step.
Animate Layout
| Yes | Nodes will animate (move) from their initial positions to the new layout positions. |
| No | The view will immediately paint the nodes in their new positions. |
Minimize Overlap
| Yes | The layout engine will spend extra time to try to keep nodes from overlapping each other. Unless you are rendering thousands of nodes, it is recommended to select this option. |
| No | For added performance, the layout engine will not try to keep nodes from overlapping each other. |
Node Tightness
A number that adjusts the closeness of nodes during a layout. Trial and error is unfortunately the only way to know what number works best for your data. Most of the time this number can be left at the default value.
Animation Time
Adjust this time in milliseconds to define how long the animation should take.
Animation Easing
| Cubic | Will initially move the nodes fast and then slow down as they get into their final position. |
| Linear | Will move the nodes to position without any speed changes. |
Hierarchical Orientation
This option is only available when Layout Type is set to “Hierarchical”.
| Down | Root Nodes are placed at the top. Children extend downwards. |
| Left | Root Nodes are placed at the right. Children extend to the left. |
| Right | Root Nodes are placed at the left. Children extend to the right. |
| Up | Root Nodes are placed at the bottom. Children extend upwards. |
Step 4: Node Renderers
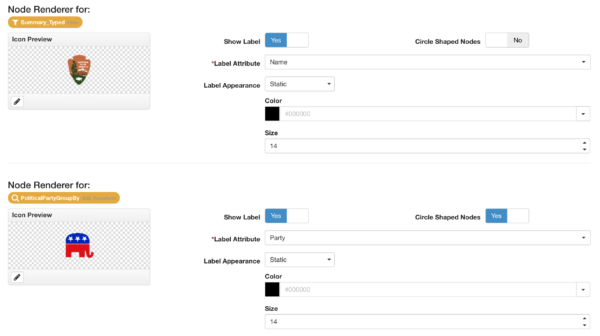
Icon Preview
Click the pencil button to configure the Icon Renderer to use on the Topology Node.
Show Label
This boolean value determines if a text label will appear below the nodes.
| Yes | Show a label. (The Label Attribute chooser will appear in the configuration) |
| No | Do not show a label. |
Circle Shaped Nodes
This boolean determines the shape of the focus highlight when a Topology Node is selected.
| Yes | Selected nodes will appear with a circular highlight. |
| No | Selected nodes will appear with a square highlight. |
Label Attribute
(required when Show Label is Yes)
Pick a field off the data to display as the label of the node.
Label Appearance
(only visible when Show Label is Yes)
When Show Label is set to Yes, you can configure a Text Renderer for the label, choosing dynamic or static styling.
See Text Renderer for more details on how to configure these options.
Latitude Attribute
(only visible when Allow Map View is Yes)
If you chose to enable the Map View, this required field will appear in the configuration dialog. You must supply a field in the data that will supply the Latitude of the node.
Longitude Attribute
(only visible when Allow Map View is Yes)
If you chose to enable the Map View, this required field will appear in the configuration dialog. You must supply a field in the data that will supply the Longitude of the node.
Step 5: Link Renderers
This section describes a feature that is available in edgeCore v3.7 or higher.
Configure the appearance of links in the topology.
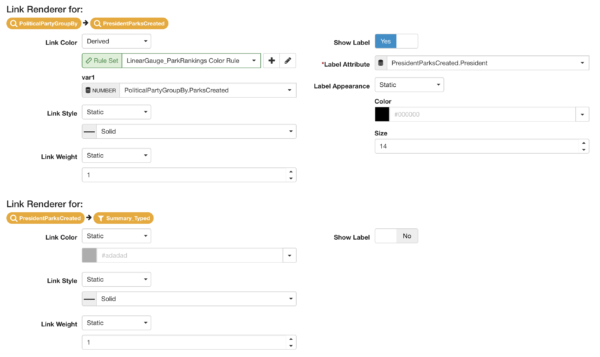
This configuration screen will list all the possible links routes in the topology. In other words, all the ways a link can be derived from the relationships defined in the Relationship Model are listed here to be uniquely styled.
Link Color
Select a static color for all links of the defined path, or derived with a Color Ruleset. See RuleSets for more details.
Link Style
Select a static style (solid, dashed, dotted) for all links of the defined path, or derive the styles from a Link Style Ruleset. See RuleSets for more details.
Link Weight (width)
Select a static weight or width for all links of the defined path, or derive the weight from a Link Weight Ruleset. See RuleSets for more details.
Show Label
This boolean value determines if a text label will appear at the center of all links.
| Yes | Show a label. (The Label Attribute chooser and Label Appearance will appear in the configuration.) |
| No | Do not show a label. |
Label Attribute
(required when Show Label is Yes)
Pick a field off the data to display as the label of the node.
Label Appearance
(only visible when Show Label is Yes)
When Show Label is set to Yes, you can configure a Text Renderer for the label, choosing dynamic or static styling.
See Text Renderer for more details on how to configure these options.
Step 6: Preview
You can preview your configuration on the last step of the wizard.
Saving Custom Layouts
This section describes a feature that is available in edgeCore v3.7 or higher.
When you are logged into the system as an administrator and view a topology in “Edit Page” mode, a new button will appear on the toolbar.
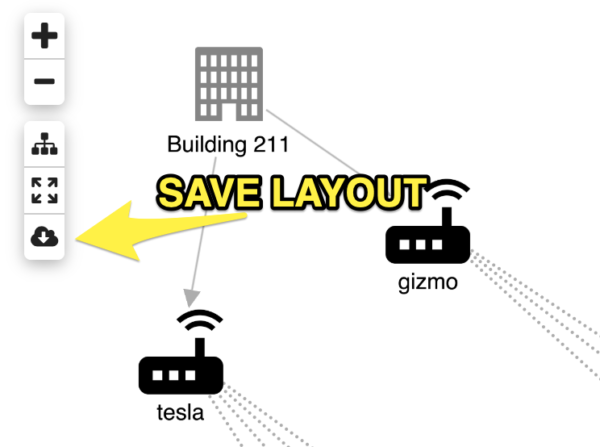
Clicking this button will save the current layout into the configuration of the visualization. Any time afterward, choosing the Custom Layout will present the saved layout.
Visualization State Persistence
EdgeCore version: 4.3.4
To specify how a visualization state (your modifications) is persisted:
- Go to the page containing the topology visualization.
- Click Edit in the top-right corner.
- Click on the three dots > Options.
A new page is displayed. - From the Visualization State Persistence dropdown, select how the state is persisted.
– Always: the state will be saved to server preferences;
– Session : the state will be saved only to client;
– None: the state will reset on each page visit;
When Visualization State Persistence is set, will be displayed, enabling you to save the layout.
 - Modify your visualization as you wish.
- Click to save the layout.
Note: if there is persisted layout data, Custom Layout will be the default layout type even if another type was previously saved as default.
Additionally, to remove past modifications made to the visualization, click the broom icon in the header and the visualization will default back to the configuration settings. Moreover, clicking the same broom icon next to the View button will remove past modifications of all visualizations on the page (provided those visualizations have persistence turned on).
