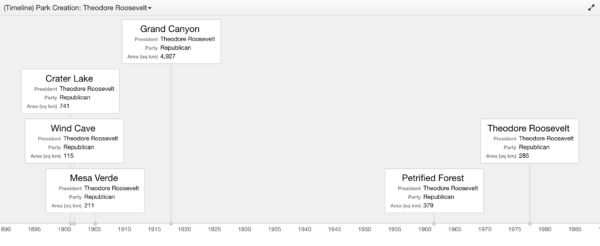
The Timeline Visualization requires a Date attribute for its X-Axis. It plots information to visualize when events took place. Each node shown in the timeline will be centered on the date/time value being for that record. A vertical red line shows the current date and time for reference.
Configuration
Timeline configuration is broken out into four steps:
- Base Timeline
Identifies the Date Field that will drive the Visualization. - Renderer
Configures the attributes to display as part of each node in the Timeline. - Layout Options
Determines the orientation and properties of the Timeline. - Preview
Previews the end result based on the choices you made.
Step 1: Base Timeline
This step identifies the Date Field that will drive the Visualization.
Visualization Name
A symbolic name used to represent this Visualization. This is the name that will show up in choosers when adding a Visualization to a Page.
Date Field
Timeline is based upon the concept of time, so this property is required in order for the Visualization to work. This field determines the X-Axis for the Visualization.
★ Note: The input will only display attributes of type Date. If nothing appears in the drop-down, then there is no attribute of the appropriate data type that was found. Data from files are commonly brought in as STRINGs. An administrator can cast attributes to the appropriate data type using pipeline Transforms.
Item Mode
Point: single date field representing an event.
Range: two date fields representing an event duration.
Boxed Item
Applicable only to item mode of point. This determines whether each Timeline item should be rendered inside a box or as transparent background without border. Set it to No if you only want to render each item as an icon.
End Date
Applicable only to item mode of range. This defines the end date of range’s duration.
Item Content Overflow
Applicable only to item mode of range. If the rendered item content length is longer than the time duration block:
clip: item content is clipped
overflow: item content is flowed outside the block.
Step 2: Renderer
This step configures the attributes to display as part of each node in the Timeline. Each attribute has its own renderer, which determines how values for that attribute will appear in the end visualization. The process is identical to how list items are configured.
Attribute Name
Selects an attribute from the underlying dataset.
Label
Attribute Names can appear as labels inside of each node. This property allows you to override a dataset’s raw attribute name with something that is better suited for this particular display.
Show Label
This property determines whether or not to display a label for the associated value.
| Yes | A label will appear to the left of the each value. |
| No | The label is hidden, and only the value will be shown. |
Value Renderer
This property determines how values for the specific attribute will be displayed inside each node on the Timeline.
See Renderers for more information about the options available with each renderer type.
Label Formatter
The label formatter is a global setting for this Visualization. It applies to all of the labels that are displayed to the left of the values in each node.
Color
Affects the colors of all labels.
Size
Affects the size of all labels.
Style
Affects the style of all labels (Bold, Italic, etc.).
Step 3: Layout Options
This step determines the orientation and properties of the Timeline display.
Axis Orientation
Determines the orientation of the timeline axis.
| Bottom | Draw the time axis at the bottom. This is the default option. |
| Top | Draw the time axis at the top. |
| Both | Draw the time axis at the bottom and the top. |
| None | Do not draw the time axis at all. |
Node Orientation
Determines whether nodes are aligned to the top or bottom of the Timeline.
| Bottom | Align the nodes to the bottom of the Timeline. This is the default option |
| Top | Align the nodes to the top of the Timeline. |
Stackable
Determines whether dense collections of nodes can be offset along the Y-Axis for better visibility.
| Yes | Nodes will not overlap. Nodes will be positioned above or below each other, ensuring that each node is visible. This will cause some nodes to paint outside of the viewable area, and a drag operation will be required in order to see them. |
| No | Nodes can overlap. All nodes are positioned at the same height, minimizing the vertical space required to present the available information. Dense collections of nodes around a single point in time will become difficult to see. Nodes that are partially obscured by other nodes can be brought to the front by the user clicking on them. |
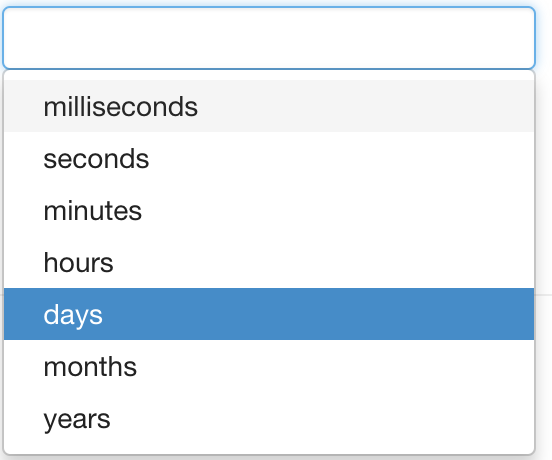
Minimum Zoom Value
Determines the smallest zoom value that user can zoom down to. The input allows for numeric value, along with a pull-down containing units of measure for time:
Date Slider Control & Sparkline Options
Show Date Slider Control
Determines whether a Date slider control appears at the bottom of the visualization.
| Yes | A date slider control will appear. |
| No | The date slider is hidden. |
Control Height
Determines the height of the slider control. Larger heights are typically used when “Show Sparkline” is enabled, giving more room to see the summary chart. This will cause the size of the footer element to grow.
| Min | 24 |
| Max | N/A |
Show Sparkline
Determines whether a Sparkline summary chart is displayed within the slider control area. The Sparkline aggregates data based on time intervals, and then displays counts based on a specified period of time.
| Yes | Displays a Sparkline summary for the current Timeline data. |
| No | The Sparkline summary is hidden. |
Aggregation
This is only displayed when Show Sparkline is Yes. The aggregation method defined here will determine how values in the data are summarized on the Sparkline.
| Count of Records | Counts the number of records that fall within each time interval. |
| Sum of | Adds together values for a specified attribute, for records that fall within each time interval. |
| First | Grabs the first value for a specified attribute, and uses that to represent all records within each time interval. |
| Last | Grabs the last value for a specified attribute, and uses that to represent all records within each time interval. |
| Min | Grabs the smallest value for a specified attribute, and uses that to represent all records within each time interval. |
| Max | Grabs the largest value for a specified attribute, and uses that to represent all records within each time interval. |
Bucket Interval
The bucket interval is used to aggregate records. Records are placed into buckets based on time stamps. The larger the bucket interval, the larger the bucket, which means they will each contain more records. Bucket Interval options include: