The Pipeline is where you manage data in edgeCore. It is rare that raw data from a source comes into edgeCore ready to be visualized. The raw data often has to be transformed or filtered in order to make an effective visualization. edgeCore’s data Pipeline provides a visual way to do this.
View Modes
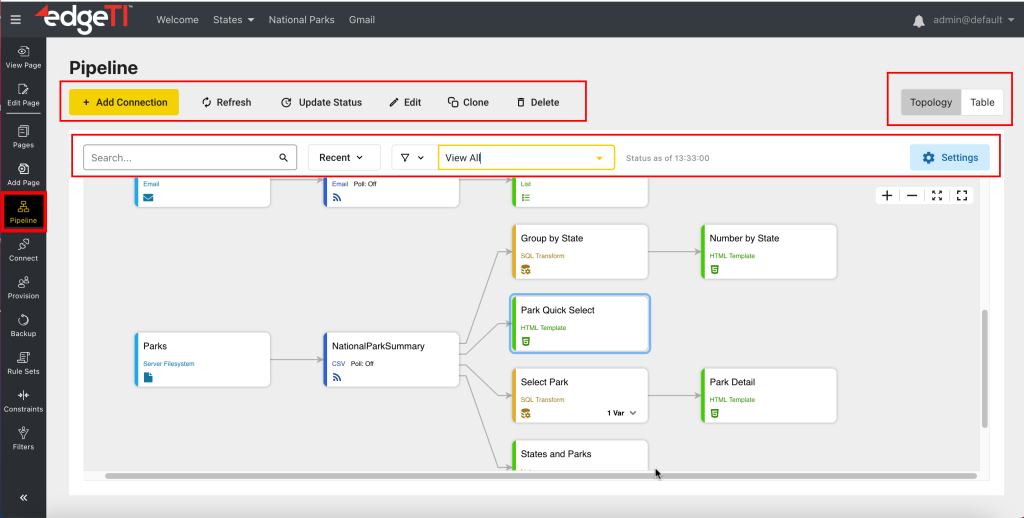
The Pipeline can be viewed in two ways: Topology and Table.
Topology view represents a graphical hierarchy that starts with a Connection and ends with a Visualization. Table view represents a flat tabular view of the nodes in a system.
Pipeline Actions
Actions you can perform on the pipeline are located at the top.
- Add Connection
Used to add a new Connection to the data Pipeline. Connections act like “root nodes” in the data pipeline, and they typically appear at the far left of the display. - Refresh
Used to reload the content. - Update Status
Used to update the status of the pipeline and refresh the topology. - Edit
Used to launch configuration for the selected node, allowing the administrator to make changes. - Clone
Used to create a clone of a selected pipeline node. - Delete
Used to delete a selected node.
Searching the Pipeline
Upon typing your search query, you will see the number of results. As you navigate between the next matched node and the previous matched node, those nodes will be highlighted.
Filtering the Data Pipeline
For information on filtering, refer to this section.
Recently Viewed Nodes
For information on the Recent dropdown, refer to this section.
Pipeline Settings
For information on pipeline settings, refer to this section.
Related page: Pipeline Overview