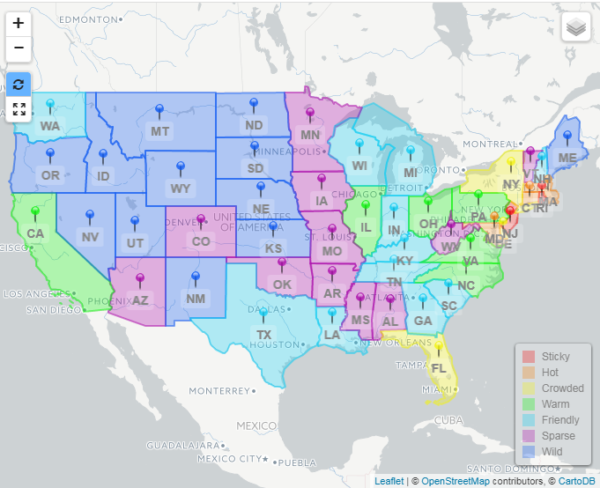
Region Map renders data that contains latitude and longitude information, but instead of placing icons, the Region Map plots geometric shapes (which represent regions) using GeoJSON.
Region Map Configuration Steps
- Base Map
- Regions
- Labels & Markers
- Optional Layers
- Preview
Step 1: Base Map
Base Map configuration for a Region Map is similar to an Icon Map.
Visualization Name
A symbolic name used to represent this Visualization. This is the name that will show up in choosers when adding a Visualization to a page.
Tile Provider
The Tile Provider controls what the map looks like. Each tile set provides its own look and feel, as well as min and max zoom ranges. These ranges are included on the right hand side of the pull-down.
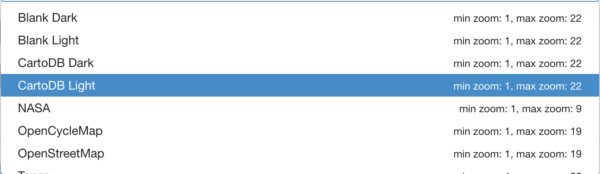
Refer to the Map Tiles and Overlays section for more information.
Default Zoom Levels
| Yes | Use the minimum and maximum zoom levels that the tile provider supports. |
| No | Specify zoom levels to support, along with the center latitude and longitude. This option is good for limiting a map to a specific region. |
Minimum Zoom
Choose the minimum zoom level that the map is allowed to show. This option is only enabled when you choose No for Default Zoom Levels.
| Min | 1 |
| Max | 22 |
Maximum Zoom
Choose the maximum zoom level that the map is allowed to show. This option is only enabled when you choose No for Default Zoom Levels.
| Min | 1 |
| Max | 22 |
Auto Zoom & Center
| Yes | Let the Visualization auto zoom the map to fit all the map markers into view. |
| No | Provide your own custom center point and zoom level to start the map on. |
Zoom Level
This sets the default zoom level for the map.
- Only visible when Auto Zoom & Center = No.
- The Default Zoom Level should be set to a value within the supported range specified by the Tile Provider.
| Min | 1 |
| Max | 22 |
Latitude
This sets the Latitude for the center point of the map.
- Only visible when Auto Zoom & Center = No.
- Value is expected in decimal format.
Longitude
This sets the Longitude for the center point of the map.
- Only visible when Auto Zoom & Center = No.
- Value is expected in decimal format.
Zoom Control
Determines the placement of the zoom control on the map. Options are:
- Bottom Left
- Bottom Right
- None
- Top Left
- Top Right
Enable Geocoding
Enables options for looking up current location based off an address.
| Yes | Turn on a search field for entering addresses to find on the map. Also adds a “Show my location” button to center the map on your current location. |
| No | Will not add a search field or “Show my location” button to the map. |
Step 2: Regions
This is where a Region Map starts to differ from an Icon Map. Instead of placing icons, the Region Map plots geometric shapes. It uses GeoJSON to define these regions.
GeoJSON File Attribute
The Attribute in the data source that contains GeoJSON file names. For example, the data source attribute File has U.S. states GeoJSON file names to be used in conjunction with “GeoJSON File URI”.
See the “Working with GeoJSON Files” section below.
GeoJSON File URI
Enter a relative URI to the GeoJSON files specified in the “GeoJSON File Attribute”. It will start from /custom which is file system location /static-web of the edgeCore deployment.
Example:
regionjsons/USA |
The example above translates to the following web URI:
/custom/regionjsons/USA
The web URI will point at the following directory on the server:
static-web/regionjsons/USA
Fill
Determines how the fill color of the regions is determined.
| Static | Statically defines the fill colors of all regions. |
| Derived | Determines a region’s fill color based on values in the data. The color will change based upon a set of rules. Refer to Rule Sets. |
A “Static” Fill
The “Static” fill option applies the same static color to all regions.
Color
Determines a static fill color for all regions.
Alpha
Determines the alpha for all regions. The Alpha value allows underlying map detail to show through the region.
| Min | 0 |
| Max | 1 |
Border Width
Determines the border size to use for all regions.
| Min | 0 |
| Max | 9 |
Border Opacity
Determines the alpha value for the border. The alpha value allows underlying map detail to show through the border.
| Min | 0 |
| Max | 1 |
A “Derived” Fill
The “Derived” fill option determines a region’s color based on values in the data. This options allows fill color to change based upon a set of rules.
Rule Set
This is the only property required for a derived fill. The individual rules within this rule set are what will determine the fill color of a region.
See the Rule Sets section for more information.
Additional Adornments
Show Label
Determines whether to show a textual label in the center of each region.
| Yes | Shows a label in the center of each region. |
| No | Text Labels are not displayed for regions. |
Show Marker
Determines whether to show an icon in the center of each region.
| Yes | Shows an icon in the center of each region. |
| No | Icons are not displayed for regions. |
For a Region Map that uses “FeatureCollection”, marker/label settings do not apply. FeatureCollection is used for complex regions containing multiple polygons. Because there is an array of polygons defining a region, edgeCore is unable to determine which polygon to use when calculating marker and label placement.
Step 3: Labels & Markers
A Label and Marker tab will appear if either “Show Label” or “Show Marker” is set to Yes on the previous step.
Marker Properties
Marker properties will appear if “Show Marker” is set to Yes on the previous step.
See Icon Renderer for more information.
Label Properties
Label properties will appear if “Show Label” is set to Yes on the previous step. Otherwise, the position of the label will be centered in the region.
Derive from Attribute
Choose an attribute from the data that contains values to be used as a label.
Formatter
Configure a formatter for the label.
Position
This section determines how the “Marker” and “Label” are positioned, relative to one another. This option is only available if “Show Marker” is also set to Yes on the previous step. Otherwise, the position of the label will be centered in the region.
Determines where the label is positioned within a region.
| Bottom | Place the label centered and below the marker. |
| Left | Place the label to the left of the marker. |
| Right | Place the label to the right of the marker. |
| Top | Place the label centered and above the marker. |
Step 4: Legend
This is will appear on the “Base Map” step of the wizard if:
- “Fill” is set to
Derived From. - “Show Marker” is set to
Yesand its Formatter Type is set toDerived From.
The legend’s colors and labels will be rendered from the derived rules’ color and label, see Rule Sets for more detail. If both cases are true, then the rule values from Fill will be used.
| Property | Description |
|---|---|
| Position | The location of Legend box on the map.Bottom LeftBottom RightNone: turn off legend.Top LeftTop Right |
| Title | Optional title for the legend box. |
| Text Color | Determines the text color of the legend’s title and key labels. |
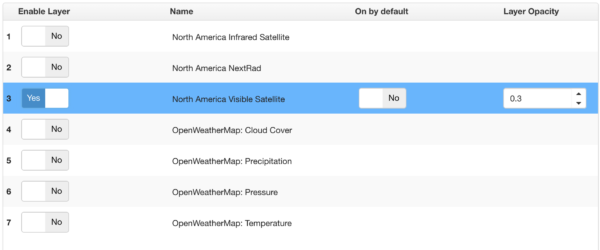
Step 5: Optional Layers
The Region Map is limited to only a weather layer. For information on other layers, refer to Icon Map.
Weather?
| Yes | Show a translucent weather layer above the map. Choosing Yes will add another step to the wizard to configure the Weather layer. |
| No | Do not add a weather layer to the map. |
Step 5a: Weather
If weather is enabled, an additional wizard step is revealed providing an administrator additional configuration options.
Step 6: Preview
This step previews the end result based on the configuration choices made.
Working with GeoJSON Files
GeoJSON is a format for encoding a variety of geographic data structures. This Visualization uses one file per area to represent the desired regions for display. An area can be a country, state, continent, or any other shape on a map. A way to generate the GeoJSON files is to search for the region by name here:
https://www.openstreetmap.org/
For example, a search for “Texas” there will return a list of entities with matching names. The top item in the resulting list is “State Boundary Texas, United States of America“. Click on that link to go to that page. At the top of the page it says “Relation: Texas (114690)“.
The number in the parentheses is the entity ID. To find the GeoJSON to download for the searched area, enter its ID number into the field labeled “Id of relation” on this page:
http://polygons.openstreetmap.fr/index.py
When submitted, the site returns a list of available polygons for the ID that was provided. The top (or only) row lists the full resolution polygon and the number of points constituting it. For the Texas example, the number of points is over 38k – excessive for use in the Visualization. There is an option to generate a simplified version of the geometry below. Adjust the X, Y and Z fields and submit to generate the reduced version. It is recommended to accept the defaults for Y and Z, but to set X to zero so that neighboring areas do not overlap. For Texas, this produces an object with approximately 800 points. From that entry in the list, download the GeoJSON link, saving it with a .json file extension.
To make GeoJSON files available to the Region Map Visualization, place the generated GeoJSON files into the /custom directory, which is located in the /static-web directory of the edgeCore deployment. You can create the /custom directory if it does not already exist in the /static-web directory.