The entitlement report lists information regarding licensed users, active users (users that logged into the system), and user sessions.
Retrieving the Entitlement Report for Standalone Instances
You can retrieve the report in the following ways:
- via URL
- via pipeline
Retrieving the Report via URL
After logging into your edgeCore instance, add entitlement/report to the URL (e.g. http://localhost:8080/entitlement/report).
This will download a .json file containing daily rollups for active and licensed users (configured users) and user sessions of logged-in users.
JSON Example
{
  "entitlementMetrics": [
    {
      "timestamp": 1612310400000,
      "clusterName": "localhost",
      "serverName": "localhost",
      "scope": null,
      "name": "userSessions",
      "licensed": -1,
      "active": 1,
      "doClass": "EntitlementMetricDO",
      "id": null
    },
    {
      "timestamp": 1612310400000,
      "clusterName": "localhost",
      "serverName": "localhost",
      "scope": null,
      "name": "users",
      "licensed": -1,
      "active": 5,
      "doClass": "EntitlementMetricDO",
      "id": null
    },
    {
      "timestamp": 1612137600000,
      "clusterName": "localhost",
      "serverName": "localhost",
      "scope": null,
      "name": "users",
      "licensed": -1,
      "active": 1,
      "doClass": "EntitlementMetricDO",
      "id": null
    },
    {
      "timestamp": 1611878400000,
      "clusterName": "localhost",
      "serverName": "localhost",
      "scope": null,
      "name": "users",
      "licensed": -1,
      "active": 1,
      "doClass": "EntitlementMetricDO",
      "id": null
    },
    {
      "timestamp": 1611792000000,
      "clusterName": "localhost",
      "serverName": "localhost",
      "scope": null,
      "name": "users",
      "licensed": -1,
      "active": 1,
      "doClass": "EntitlementMetricDO",
      "id": null
    }
  ],
  "validation": "$2a$10$WemTfyILpUrrxd0R9Nk0OeCQxXbLgDS5lRLJAi1L1qCq1yJF0sIlm"
}
Note: If "licensed": -1, this means the license is unlimited.
Additionally, you can retrieve other rollups by adding entitlement/metrics/rollup to the URL (e.g. http://localhost:8080/entitlement/metrics/rollup – daily rollup by default).
Rollup can be:
- yearly (e.g. http://localhost:8080/entitlement/metrics/yearly)
- monthly (e.g. http://localhost:8080/entitlement/metrics/monthly)
- daily (e.g. http://localhost:8080/entitlement/metrics/daily)
- hourly (e.g. http://localhost:8080/entitlement/metrics/hourly)
- full (e.g. http://localhost:8080/entitlement/metrics/full; retrieves all samples, which are taken at the top of every hour)
Retrieving the Report via Pipeline
To generate and view the entitlement report in the pipeline, take the following steps:
-
- Click
 .
.
The pipeline is displayed. - Click + in the lower-left corner to create a new connection.
A pop-up for choosing a connection type is displayed. - In the pop-up, select System / System Metrics connection type.
- Click Use Selected.
A new page is displayed. - In Connection Name, enter a name (for example, Report).
- Make sure the Enable Connection toggle is on.
- Click Next.
You are taken to the Test Connection tab where the confirmation message Connection test was successful is displayed. - Click Save and Close.
The newly created connection is displayed in the list of connections. - Click the gear icon button in the Report connection box and select + .
A new page is displayed. - In Feed Name, enter a name (for example, Entitlement).
- From the Choose metrics group drop-down, select Entitlement.
- Turn on the Advanced Update Scheduling toggle and select the Hourly option.
If desired, change the dropdown values for hours, minutes, and seconds to further customize the refresh interval. Alternatively, Poll Interval can be set, with the value being in seconds.
Note: the server writes new entitlement metrics data to the database at the top of every hour. Refreshing the feed more frequently than that should not be necessary. - Turn on the Enable Server Subscription toggle in order for data for this feed to be refreshed according to the interval set in the previous step.
- Click Next.
You are taken to the Attributes DB Options tab. No changes are needed here, so click Next to go to Data Preview. On the Data Preview tab, you can view the report. - Click Save and Close.
The newly created feed is displayed in the pipeline. From there, you can proceed with creating a visualization for your report.
- Click
Retrieving the Entitlement Report for the Command Center
You can retrieve the report in the following ways:
- via UI
- via URL
Retrieving the Report for the Command Center via UI
- Log into the Command Center.
- Click on the hamburger menu > Enterprise > Download Entitlement Report.
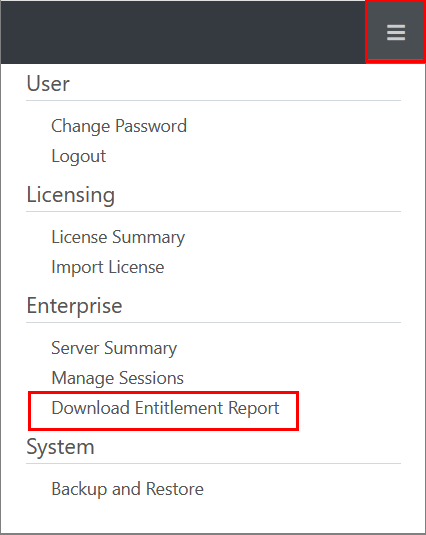
- Download the .json file containing rollups for active and licensed servers.
JSON Example
{
  "entitlementMetrics": [
    {
      "timestamp": 1612396800000,
      "clusterName": "ip-172-31-32-18",
      "serverName": "ip-172-31-32-18",
      "scope": null,
      "name": "server.*",
      "licensed":-1,
      "active": 2,
      "doClass": "EntitlementMetricDO",
      "id": null
    },
    {
      "timestamp": 1612396800000,
      "clusterName": "server2",
      "serverName": "server2",
      "scope": null,
      "name": "server.*",
      "licensed": -1,
      "active": 2,
      "doClass": "EntitlementMetricDO",
      "id": null
    }
  ],
  "validation": "$2a$10$BbVM.D4dsyMyfn1CCToEheIP9tZIyBk7ZlvwlSt/xPgTCb0.tveNa"
}
Retrieving the Report for the Command Center via URL
After logging into the Command Center, add enterprise/entitlement/report to the URL (e.g. http://localhost:8080/enterprise/entitlement/report).
This will download a .json file containing rollups for active and licensed servers.
Additionally, you can retrieve other rollups by adding enterprise/entitlement/metrics/rollup to the URL (e.g. http://localhost:8080/enterprise/entitlement/metrics/rollup).
Rollup can be:
- yearly (e.g. http://localhost:8080/enterprise/entitlement/metrics/yearly)
- monthly (e.g. http://localhost:8080/enterprise/entitlement/metrics/monthly)
- daily (e.g. http://localhost:8080/enterprise/entitlement/metrics/daily)
- hourly (e.g. http://localhost:8080/enterprise/entitlement/metrics/hourly)
- full (e.g. http://localhost:8080/enterprise/entitlement/metrics/full; retrieves all samples, which are taken at the top of every hour)
When is the Entitlement Data Updated?
By default, the entitlement data is updated (i.e. the server adds new data to the entitlement metrics table in the database) at the top of every hour.
Viewing the Number of Recently Logged-in Users
edgeCore Version: 4.3.6
For both the standalone instance and Command Center, the generated JSON shows the number of users who logged in:
- in the last year (“usersLast365”)
- in the last month (“usersLast30”)
- in the last week (“usersLast7”)
JSON example:
{
  "entitlementMetrics": [
    {
      "timestamp": 1614211200000,
      "clusterName": null,
      "serverName": "instance.name",
      "scope": null,
      "name": "userSessions",
      "licensed": -1,
      "active": 6,
      "usersLast365": 1,
      "usersLast30": 1,
      "usersLast7": 1,
      "doClass": "EntitlementMetricDO",
      "id": null
    }
],
  "validation": "$2a$10$EyaxiKwFviuMRM313oygqeNVTrzAymMri5D/.XSNwoPuE.5XBJkD2"
}
Please note that your instance.name (stored in the local.properties configuration file) is the serverName.
edgeCore 4.3.7 Version
The metrics are broken into name, active, and licensed.
In name, you can view the following separate metrics:
- activeUsers
- activeUsersPast30Days
- activeUsersPast365Days
- activeUsersPast7Days
- connection.*
- connection.module.edge.edgeData
- connection.module.edge.edgeWeb
- domains
- server.*
- session.*
- userSessions
- users
JSON example
{
  "entitlementMetrics": [
    {
      "timestamp": 1621728000000,
      "clusterName": null,
      "serverName": "DESKTOP-74VIARU.s4em35-l84mao9mi949",
      "name": "activeUsers",
      "licensed": -1,
      "active": 2,
      "doClass": "EntitlementMetricDO"
    },
    {
      "timestamp": 1621728000000,
      "clusterName": null,
      "serverName": "DESKTOP-74VIARU.s4em35-l84mao9mi949",
      "name": "activeUsersPast30Days",
      "licensed": -1,
      "active": 3,
      "doClass": "EntitlementMetricDO"
    },
    {
      "timestamp": 1621728000000,
      "clusterName": null,
      "serverName": "DESKTOP-74VIARU.s4em35-l84mao9mi949",
      "name": "activeUsersPast365Days",
      "licensed": -1,
      "active": 3,
      "doClass": "EntitlementMetricDO"
    },
    {
      "timestamp": 1621728000000,
      "clusterName": null,
      "serverName": "DESKTOP-74VIARU.s4em35-l84mao9mi949",
      "name": "activeUsersPast7Days",
      "licensed": -1,
      "active": 3,
      "doClass": "EntitlementMetricDO"
    },
    {
      "timestamp": 1621728000000,
      "clusterName": null,
      "serverName": "DESKTOP-74VIARU.s4em35-l84mao9mi949",
      "name": "connection.*",
      "licensed": -1,
      "active": 1,
      "doClass": "EntitlementMetricDO"
    },
    {
      "timestamp": 1621728000000,
      "clusterName": null,
      "serverName": "DESKTOP-74VIARU.s4em35-l84mao9mi949",
      "name": "connection.module.edge.edgeData",
      "licensed": -1,
      "active": 13,
      "doClass": "EntitlementMetricDO"
    },
    {
      "timestamp": 1621728000000,
      "clusterName": null,
      "serverName": "DESKTOP-74VIARU.s4em35-l84mao9mi949",
      "name": "connection.module.edge.edgeWeb",
      "licensed": -1,
      "active": 0,
      "doClass": "EntitlementMetricDO"
    },
    {
      "timestamp": 1621728000000,
      "clusterName": null,
      "serverName": "DESKTOP-74VIARU.s4em35-l84mao9mi949",
      "name": "domains",
      "licensed": -1,
      "active": 1,
      "doClass": "EntitlementMetricDO"
    },
    {
      "timestamp": 1621728000000,
      "clusterName": null,
      "serverName": "DESKTOP-74VIARU.s4em35-l84mao9mi949",
      "name": "server.*",
      "licensed": -1,
      "active": 1,
      "doClass": "EntitlementMetricDO"
    },
    {
      "timestamp": 1621728000000,
      "clusterName": null,
      "serverName": "DESKTOP-74VIARU.s4em35-l84mao9mi949",
      "name": "session.*",
      "licensed": -1,
      "active": 0,
      "doClass": "EntitlementMetricDO"
    },
    {
      "timestamp": 1621728000000,
      "clusterName": null,
      "serverName": "DESKTOP-74VIARU.s4em35-l84mao9mi949",
      "name": "userSessions",
      "licensed": -1,
      "active": 0,
      "doClass": "EntitlementMetricDO"
    },
    {
      "timestamp": 1621728000000,
      "clusterName": null,
      "serverName": "DESKTOP-74VIARU.s4em35-l84mao9mi949",
      "name": "users",
      "licensed": -1,
      "active": 5,
      "doClass": "EntitlementMetricDO"
    }
],
  "validation": "$2a$10$.TDCJDfHLcIZUGn5rFOP5eNOjfVtrX6s7AQgHCP7l2hm/FGxaA2pu"
}
Generating Entitlement Usage Report
edgeCore version; 4.3.8
To help you better understand the usage, you can generate and validate reports for a given time range by using the following command:
ur [-s] [-e] [--validate] [-d] [-f] [-i] -o
The reports can be generated on the Command Center or individual instances. The outputs can be validated on any instance.
The Command Center will generate the report on all servers reporting to it, while individual instances will only report on themselves.
When generating reports, you can:
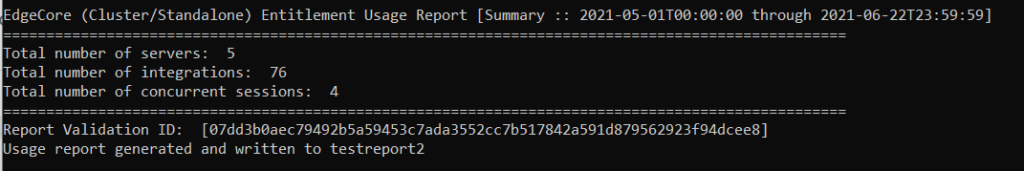
- Generate a summary report [-s] for a given time range [-e] by running:
bin/es-cli.sh --url http://localhost:8080 --user admin --pass admin ur -s 2021-06-01 -e 2021-06-22 -o testreport2
Example response:
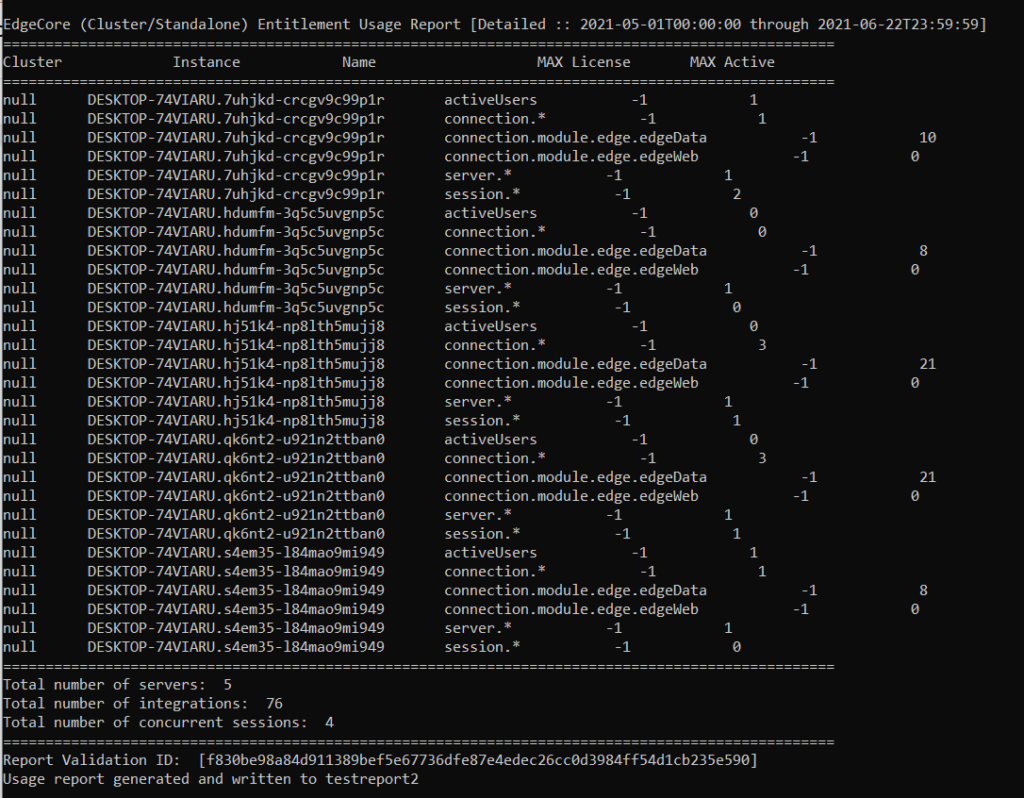
- Generate a detailed report [-d] [-s] for a given time range [-e] by running:
bin/es-cli.sh --url http://localhost:8080 --user admin --pass admin ur -d -s 2021-06-01 -e 2021-06-22 -o testreport2
Example response:
- Validate the report by running:
bin/es-cli.sh --url http://localhost:8080 --user admin --pass admin ur --validate -i testreport2
Example response:
Usage report validation returned: SUCCESS
Additionally, you can also filter the usage [-f] by servers, integrations, users, or sessions. If [-f] is not provided, then servers, integrations, and sessions will be returned (as seen in the example above).
For example, if you want to filter just by servers and users, you would run the following:
bin/es-cli.sh --url http://localhost:8080 --user admin --pass admin ur -f servers,users -s 2021-06-01 -e 2021-06-22 -o testreport2