The Date Range slider is a type of client filter in a Visualization that provides a graphical way of selecting a period of time. It takes up more space than a Date Range Picker, but offers the ability to summarize the underlying data. The summarized view provides context, making it easier to select a date range of interest.
Applying a Date Range Slider Filter to a Visualization
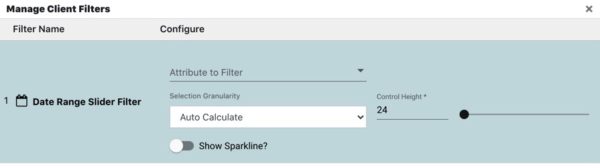
There is no configuration dialog for a Date Range Slider. However, there are lot of properties available when applying a Date Range Slider to a Visualization (shown below).
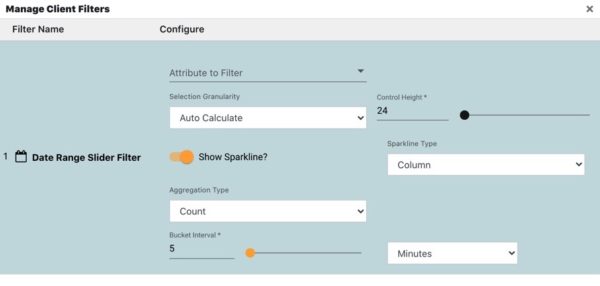
When “Show Sparkline” is enabled, several more options appear:
| Properties | Description |
|---|---|
| Attribute to Filter | An attribute in the Visualization’s dataset that contains DATE values. The values in this attribute are what the filter will work against. |
| Selection Granularity | Determines how sensitive the slider’s axis is. “Auto Calculate” will maximize the sensitivity based on the available space. |
| Control Height | Determines the height of the slider component. Larger heights are typically used when “Show Sparkline” is enabled, giving more room to see the summary chart. This will cause the size of the footer element to grow. Note: The minimum height allowed is 24px. |
| Show Sparkline | Toggles a Sparkline summary chart on and off. – Yes: A simplified Chart will be shown underneath the slider. – No: The summary chart will be hidden, revealing only a slider. |
| Sparkline Type | Determines the type of chart to use: – Area – Column |
| Aggregation Type | Specifies the type of aggregation used for the buildup of each bucket. – Sum: Adds up the values for “Sparkline Data” attribute, for all records that fall within the specified interval. – Count: The total number of records for the specified time interval. Selecting Count will ignore the values in the Sparkline Data attribute, and return the total number of records for the specified interval. – First – Last – Min – Max |
| Sparkline Data | An attribute that contains values to use when calculating buckets. The values in this attribute will be used with Aggregation Types that require some form of calculation, such as Sum, First, Last, Min, and Max. |
| Bucket Interval | A time interval that determines the size of each bucket. It decides how many records will go into each bucket based on time. It accommodates the following units of measure. – Years – Months – Days – Hours – Minutes – Seconds |
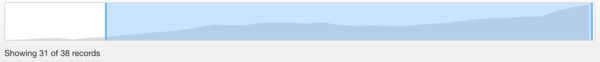
Example Area Sparkline
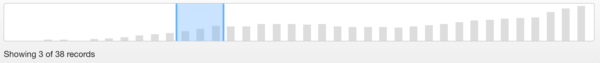
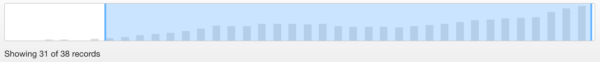
Example Column
Adjusting the Date Time Slider Filter
Dragging either side of the slider will adjust the range.