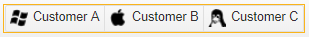
A Custom Expression Filter lets you set up a group of different expressions that can be used to filter data. These expressions can be represented as a button bar, or as a drop-down. Each expression shows up as an individual item in the pull-down, or as its own button.
Create a Custom Expression Filter
To create a Custom Expression Filter, perform the following steps:
- Log in to edgeCore as an administrator.
- Open a Page in Edit Mode.
- Above the Visualization in which you want to add the filter, click the gear button to show the options drop-down menu.
- Select “Edit Filters”.
- On the “Manage Client Filters” dialog, click
+to add a new filter. - On the “Select Client Filter” dialog, click
+Add to show the selection list. - Click to select “Custom Expression Filter”.
User Interface
The user interface is comprised of a list of expressions, which can be reused throughout the system.
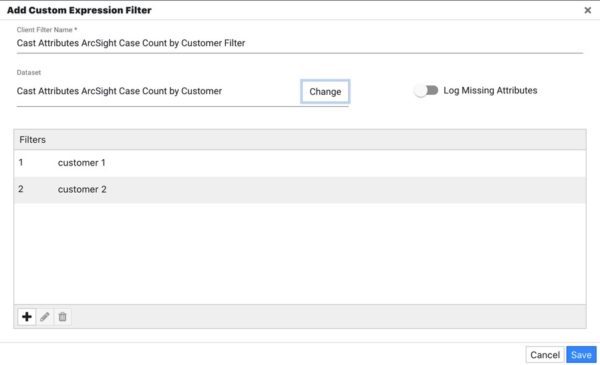
Properties
| Name | Description |
|---|---|
| Client Filter Name | Name used to identify this Client Filter. |
| Dataset | The name of the dataset that each filter rule’s attribute list is based on. Click on it to change it. |
| Log Missing Attributes | If this filter is applied to a dataset that is missing some of the attributes used in the rules, log a message to admin users that use it. |
| Filters | Each item in the list represents an individual expression. Each item in this list will be rendered in a toggle button bar. |
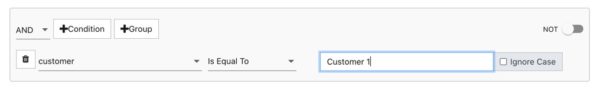
Filter Expressions
Each expression can be written independently and can compare as many columns as necessary. The following example below shows a filter expression that examines values in two different attributes using the AND operator.
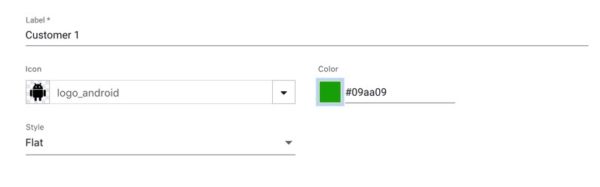
Renderer
Each expression is associated with its own renderer. The renderer supports the following properties:
| Property | Description |
|---|---|
| Label | Textual label to use for the expression. |
| Icon | Icon that represents the expression. |
| Icon Color | Icon color to use for the expression. |
| Style | Style to apply to the icon. |
Applying a Custom Expression Filter to a Visualization
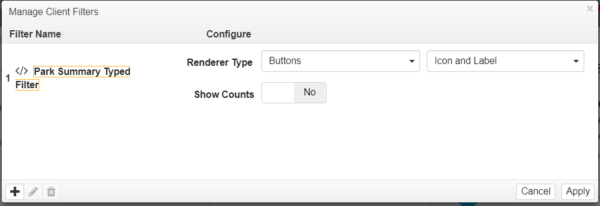
When applying a Custom Expression Filter to a Visualization, the administrator can decide how much of the configured renderer to show based on available real estate.
Properties
| Property | Description |
|---|---|
| Renderer | Determines the type of renderer to use for each item in the specified renderer: – Icon: Only an icon will appear. – Label: Only the label will appear. – Icon and Label: Both icon and label will appear. |
| Renderer Type | Determines the type of input control to use: – Buttons – Dropdown |
| Show Unfiltered Counts | A numeric summary of how many records in the unfiltered dataset there are for the configured filter. It will be displayed as Filtered Counts/Unfiltered Counts – Yes: Show a record count. – No: Do not show a record count. |
| Show Filtered Counts | A numeric summary of how many filtered records there are for the configured filter. This count is based on the result of applying other filters in the visualization. – Yes: Show a record count. – No: Do not show a record count. |
| Cleared Label | A label that represents “Clear” or “Show All”. |
Error Condition
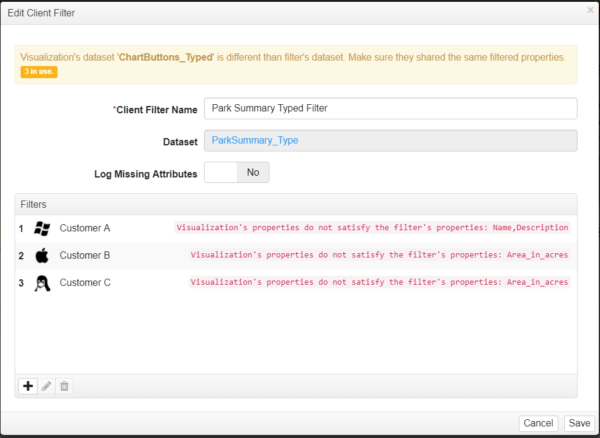
If this filter is applied to a dataset that is missing some of the attributes used in the rules, as an administrator you will see the filter being highlighted with orange border as follows:
Once you bring up the “Edit Filters” dialog you will see it:
And when you click edit on the problem filter you will see: