Now you are going to configure an action that will switch to another page when a user clicks a node on the map. This new page will display sales data for all the counties in the state that the user selected. This will take a few steps to set up. First, you will need to configure the data and visualization that you want to display on the new page. Afterward, you will need to create the page, and lastly, you will create the action to switch to the page.
New Data Feed
The first of the five steps in creating your Switch to Page action is to access the data that will be displayed on the page that you are switching to.
Perform the following steps to create a new data feed with county data:
- Click
 .
.
The pipeline is displayed. - Click the gear icon button in the getting_started connection box and select + .
A pop-up for choosing a feed type is displayed. - In the pop-up, select CSV.
A new page is displayed. - In Feed Name, enter state_counties.
- In File Name, select state_counties.csv.
- In Poll Interval, enter 1.
- Turn the Enable Server Subscription toggle in order for data for this feed to be continually fetched, updated, and cached based on the poll interval.
- Click Next.
You are taken to the CSV Parser tab. - On the CSV Parser tab, in Header Meta Delimiter, enter *.
- Click Next.
You are taken to the Attributes DB Options tab. No changes are needed here, so click Next to go to Data Preview. On the Data Preview tab, you can observe the data preview of the state_counties feed from the getting_started connection. - Click Save and Close.
The newly created feed is displayed in the pipeline.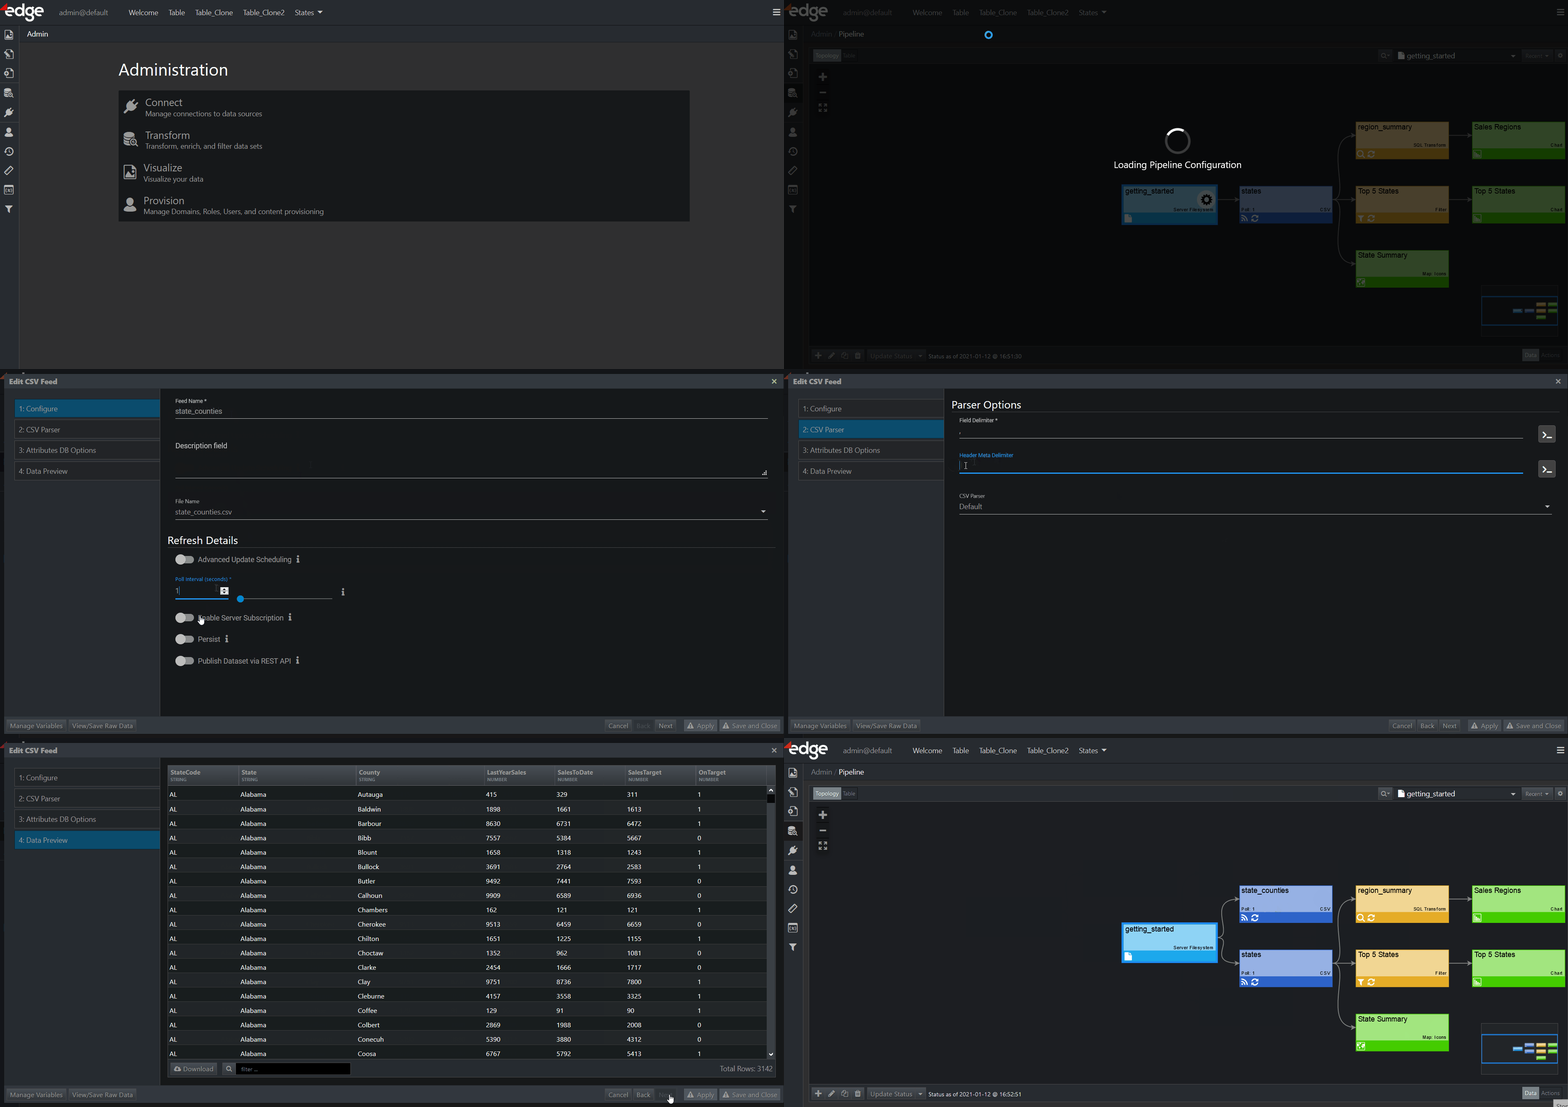
New Transform
The second of the five steps in creating your Switch to Page action is to set up a transform to query the data in the new state_counties feed so that it will only contain data for counties in one selected state.
- Click
 .
.
The pipeline is displayed. - Click the gear icon button in the state_counties feed box.
- Select +, and then New Transform.
A pop-up for choosing a transform type is displayed. - In the pop-up, select SQL Transform.
A new page is displayed. - In Transform Name, enter filtered_state_counties.
- Turn on the Enable Server Subscription toggle in order for data for this feed to be continually fetched, updated, and cached based on the poll interval.
- Click Next.
You are taken to the Query tab. - On the Query tab, do the following:
a) In Query, paste the following into the query box to replace the default query text:xselect * from {src.state_counties}where State =b) Click in the space next to = and then click Insert Variable > Node Variable.
A pop-up is displayed.
– In the pop-up, click + to add a variable. A new page is displayed.
– In Name, enter selectedState.
– From the Constraint drop-down, select Unbounded String.
– In Default Value, enter Alabama.
– Click Save. You are taken back to the pop-up.
– Click on the new selectedState variable to select it.
– Click Insert Variable.
c) The Query field should look like this now:select * from {src.state_counties} where State = {safeNodeVar.selectedState}d) Click Next.
You are taken to the Attributes DB Options tab. No changes are needed here, so click Next to proceed. Similarly, no changes are needed for the Upstream Variables tab, so click Next to go to Data Preview. On the Data Preview tab, you can observe the data preview of the filtered_state_counties transform from the getting_started connection. - Click Save and Close.
The newly created transform is displayed in the pipeline.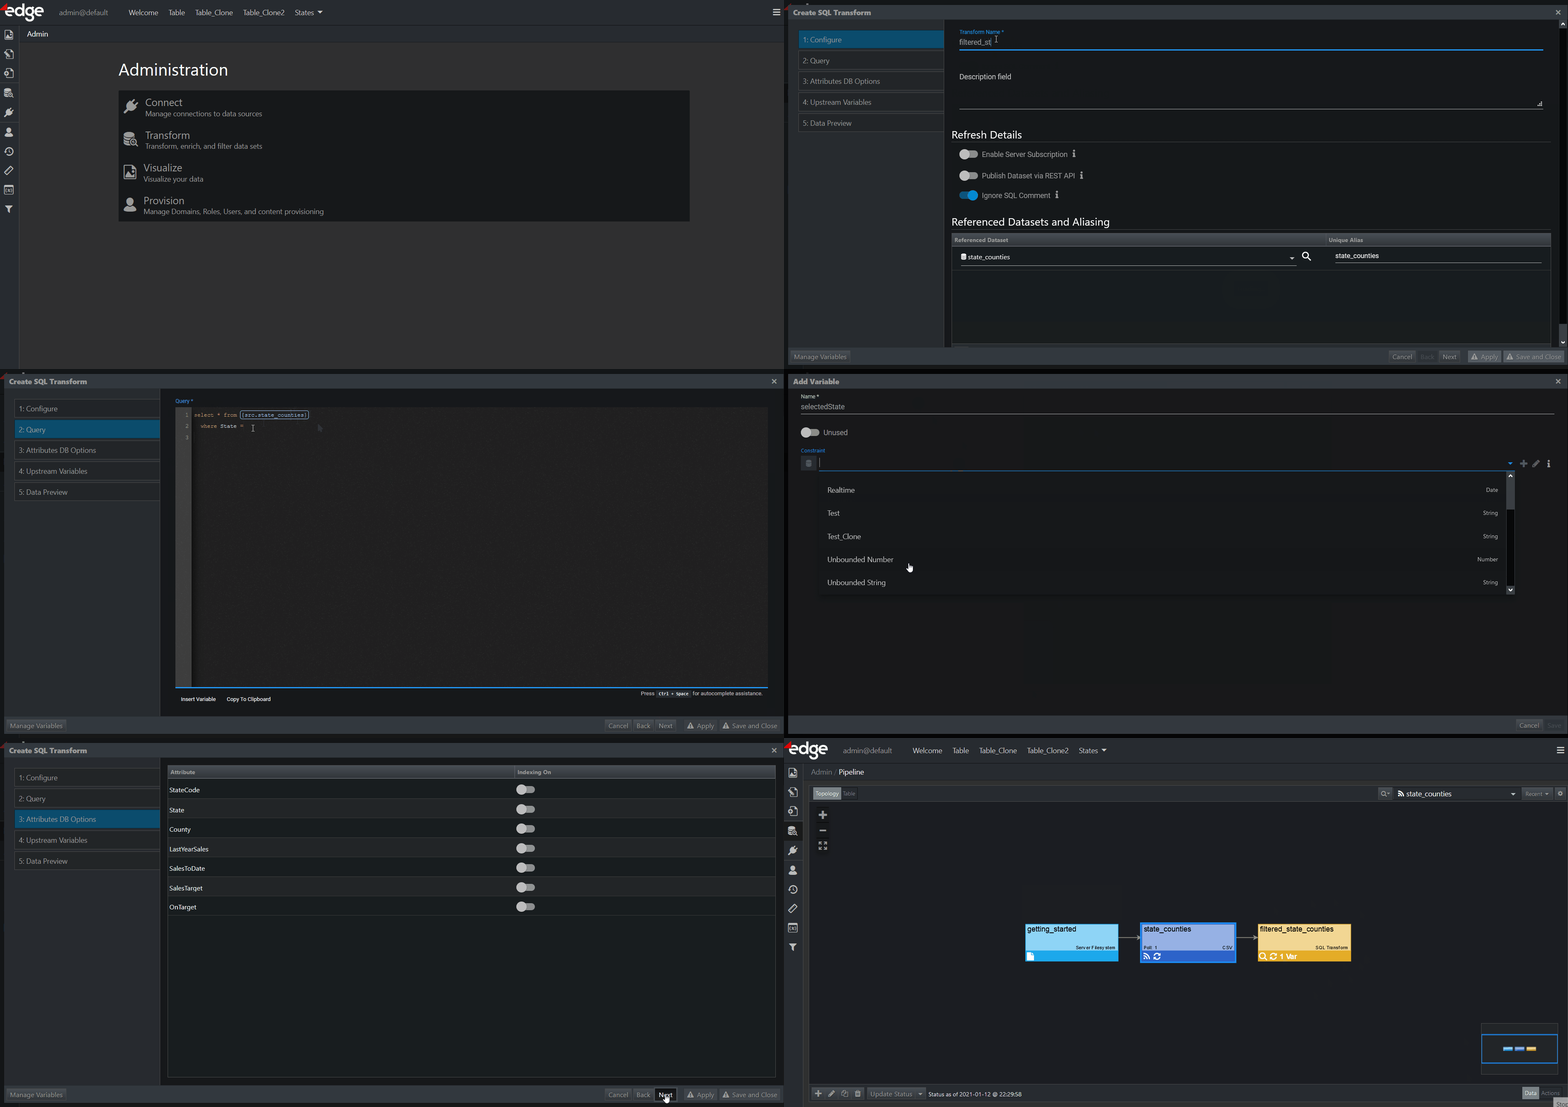
Additional Steps
Perform the following additional steps to constrain values of the selectedState variable to a list of states:
- Click
 .
.
A list of constraints is displayed. - Click + to add a new constraint.
A pop-up is displayed. - From the Constraint Data Type drop-down, select String.
- Click OK.
A new page is displayed. - On the page, do the following:
a) In Name, enter stateList.
b) Disable the Static toggle switch. Additional fields are displayed.
c) From the Dataset drop-down, select states.
d) From the Value Attribute drop-down, select State.
e) Enable the Use Value as Label toggle switch. Values are displayed on the right.
f) Click Save. - Go to the pipeline.
- In the pipeline, double-click on the filtered_state_counties SQL transform.
The transform’s configuration is displayed. - Click the Query tab and do the following:
a) Click Insert Variable > Node Variable. A pop-up is displayed.
b) In the pop-up, click selectedState to select it and then click the pencil icon. A new page is displayed.
c) From the Constraint drop-down, select State List.
d) Click Save. You are taken back to the pop-up.
e) Click Close. You are taken back to the Query tab. - Click Next three times to go to the Data Preview tab.
The selectedState variable now provides a drop-down list of states as a result of assigning the stateList constraint that you created. - From the selectedState drop-down, select Texas.
- Click Apply to Preview to see that the data preview is updated.
- Click Save and Close.
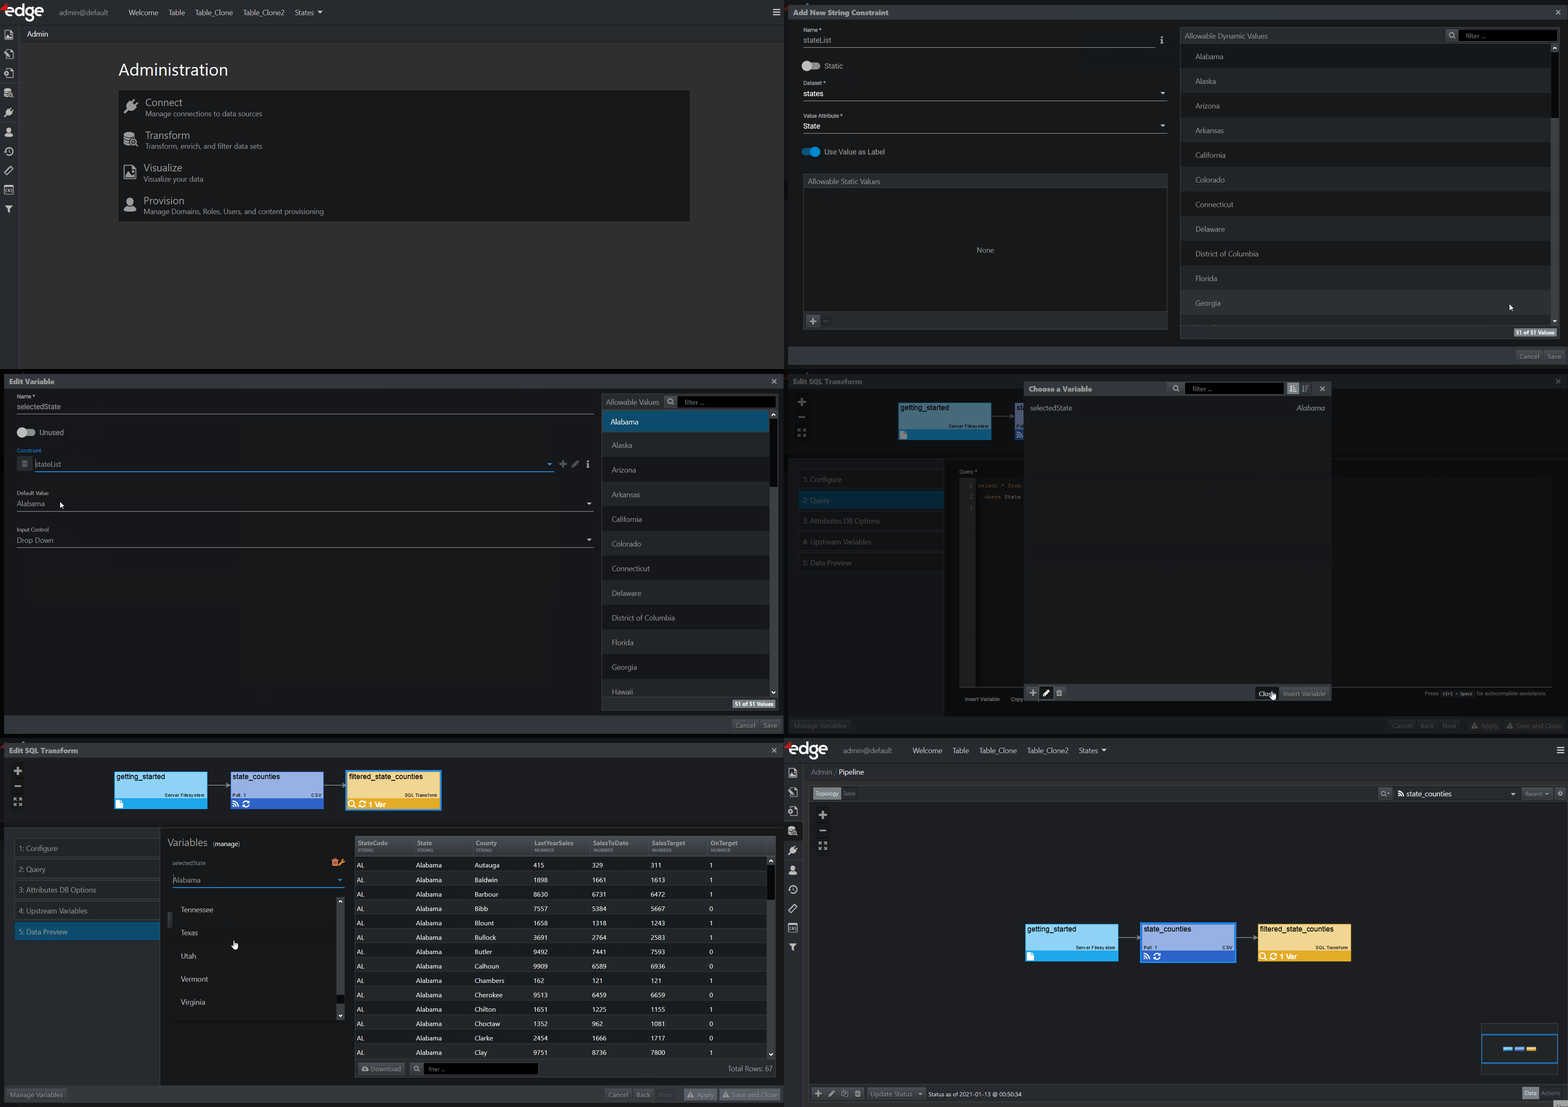
Table Visualization
The third of the five steps in creating your Switch to Page action is to create a visualization to display on the page that users will be switching to.
Perform the following steps to create a table visualization with the new county data:
- Click
 .
.
The pipeline is displayed. - Click the gear icon button in the filtered_states_counties transform box.
- Select +, and then New Visualization.
A pop-up for choosing a visualization is displayed. - In the pop-up, select Table.
A new page is displayed. - On the Base Table tab, do the following:
a) In Visualization Name, enter Sales by County.
b) Leave all default options and values as they are.
c) Click Next.
You are taken to the Columns tab. - On the Columns tab, do the following:
a) Remove 2 columns by selecting them and clicking – in the bottom left corner.
b) For the first Attribute Name, select OnTarget.
c) For the second Attribute Name, select County.
d) For the third Attribute Name, select LastYearSales.
e) For the fourth Attribute Name, select SalesToDate.
f) For the fifth Attribute Name, select SalesTarget.
g) Click Next. You are taken to the Column Renderers tab. - On the Column Renderers tab, do the following:
a) For Column Name OnTarget, select Icon for Cell Renderer.
– Click the pencil icon next to the Icon to edit the renderer. A pop-up is displayed.
– Click next to the Icon field to derive an icon. A field for selecting a rule set is displayed.
– Click to create a rule set. A new page is displayed.
– In Name, enter SalesOnTarget.
– Click Next. You are taken to the Variables tab.
– In Name, enter CountyTarget, and select Number for Type.
– Click Next. You are taken to the Rules tab.
– Click + twice to add two rules.
– For Rule 1, click + Condition, and leave CountyTarget=0. Click to enter the formatter. In the formatter pop-up, search for an X icon (filter all categories). Select the X icon and apply your changes.
– For Rule 2, click + Condition, and make sure CountyTarget=1. In the formatter, search for a check icon. Select the check icon and apply your changes.
– Click Save and Close.
b) From the CountyTarget drop-down, select OnTarget.
c) In Color, click to derive a color. A field for selecting a rule set is displayed.
– Click to create a rule set. A new page is displayed.
– In Name, enter SalesOnTarget.
– Click Next. You are taken to the Variables tab.
– In Name, enter CountyTarget, and select Number for Type.
– Click Next. You are taken to the Rules tab.
– Click + twice to add two rules.
– For Rule 1, click + Condition, and leave CountyTarget=0. Click to enter the formatter. In the formatter pop-up, set red for Color. Apply your changes.
– For Rule 2, click + Condition, and make sure CountyTarget=1. In the formatter, set green for Color and apply changes.
– Click Save and Close.
d) From the CountyTarget drop-down, select OnTarget.
e) Click Apply. - Click Next.
You are taken to the Sort tab. No changes are needed here, so click Next to proceed. On the Preview tab, the table shows columns for five selected attributes. - Click Save and Close.
The Sales By County table visualization is displayed in the pipeline.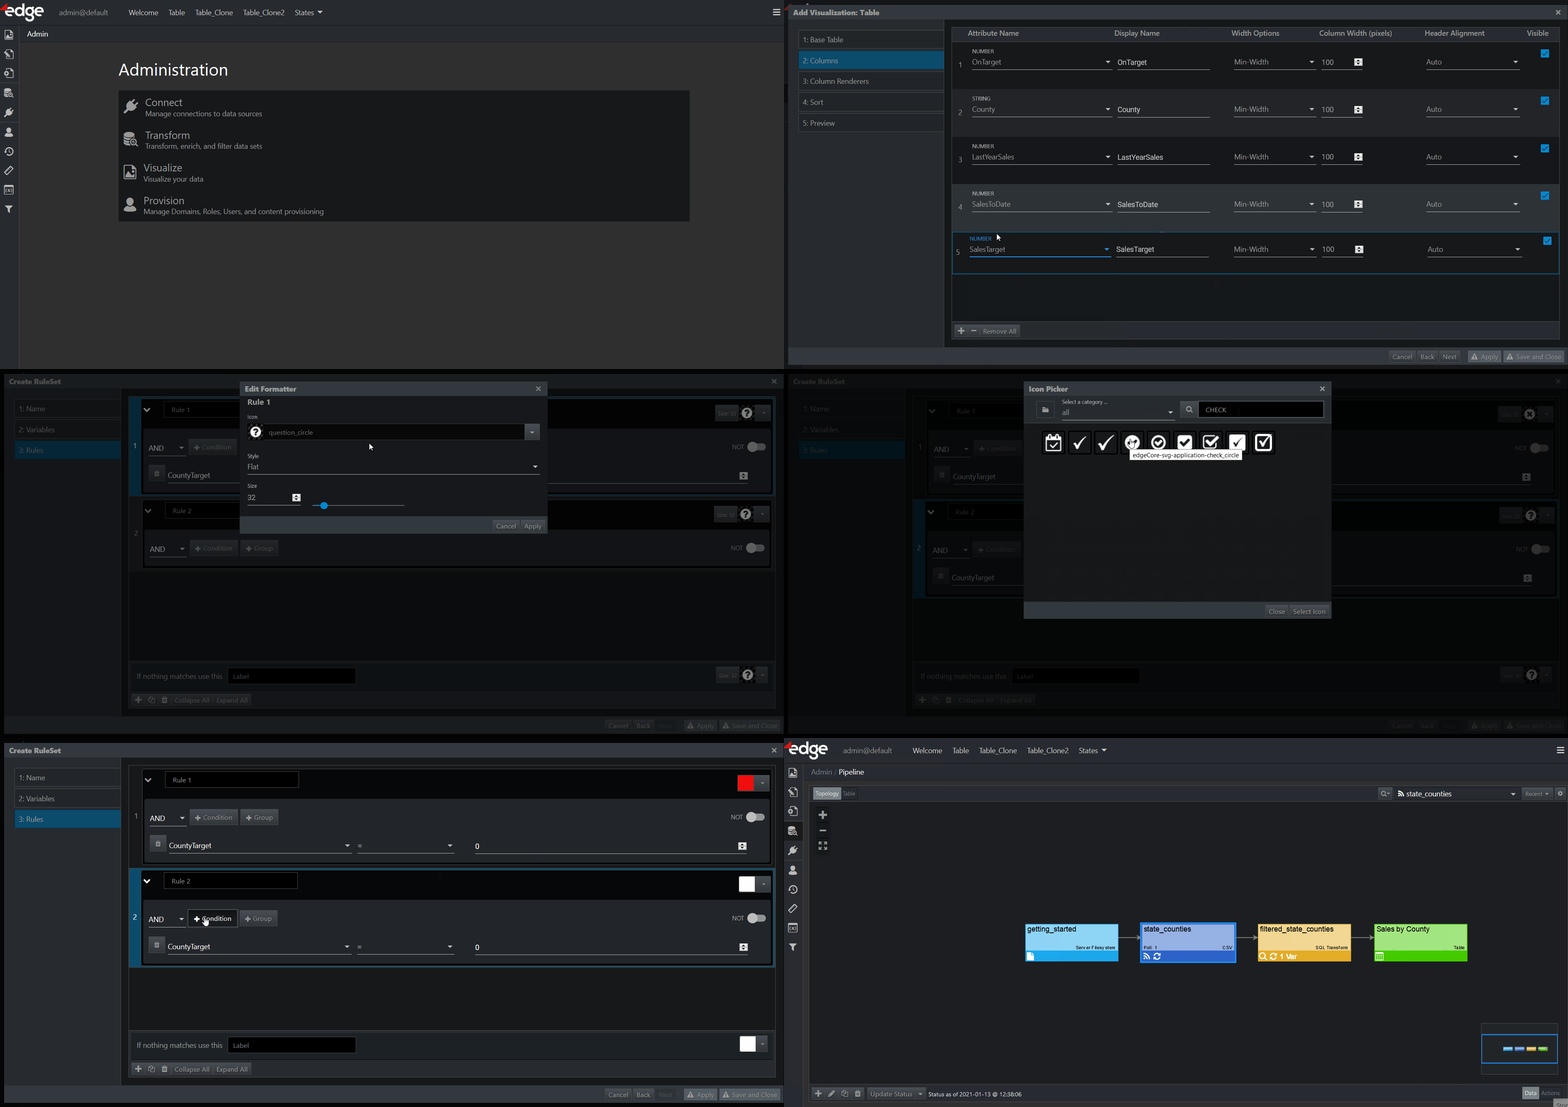
New Page
The fourth of the five steps in creating your Switch to Page action is to create the page that users will be switching to.
Perform the following steps to create a new page that will be this destination:
- Click
 to access pages.
Content Menu is displayed. - Click the States folder to select it.
- Click
 to add a page to the folder.
A pop-up is displayed. - In the pop-up, do the following:
a) In Page Name, enter State Summary.
b) Select Hide from Menu.
c) Click Save.
The State Summary page is displayed in the Content Menu, but not in the navigation menu as we chose to hide it.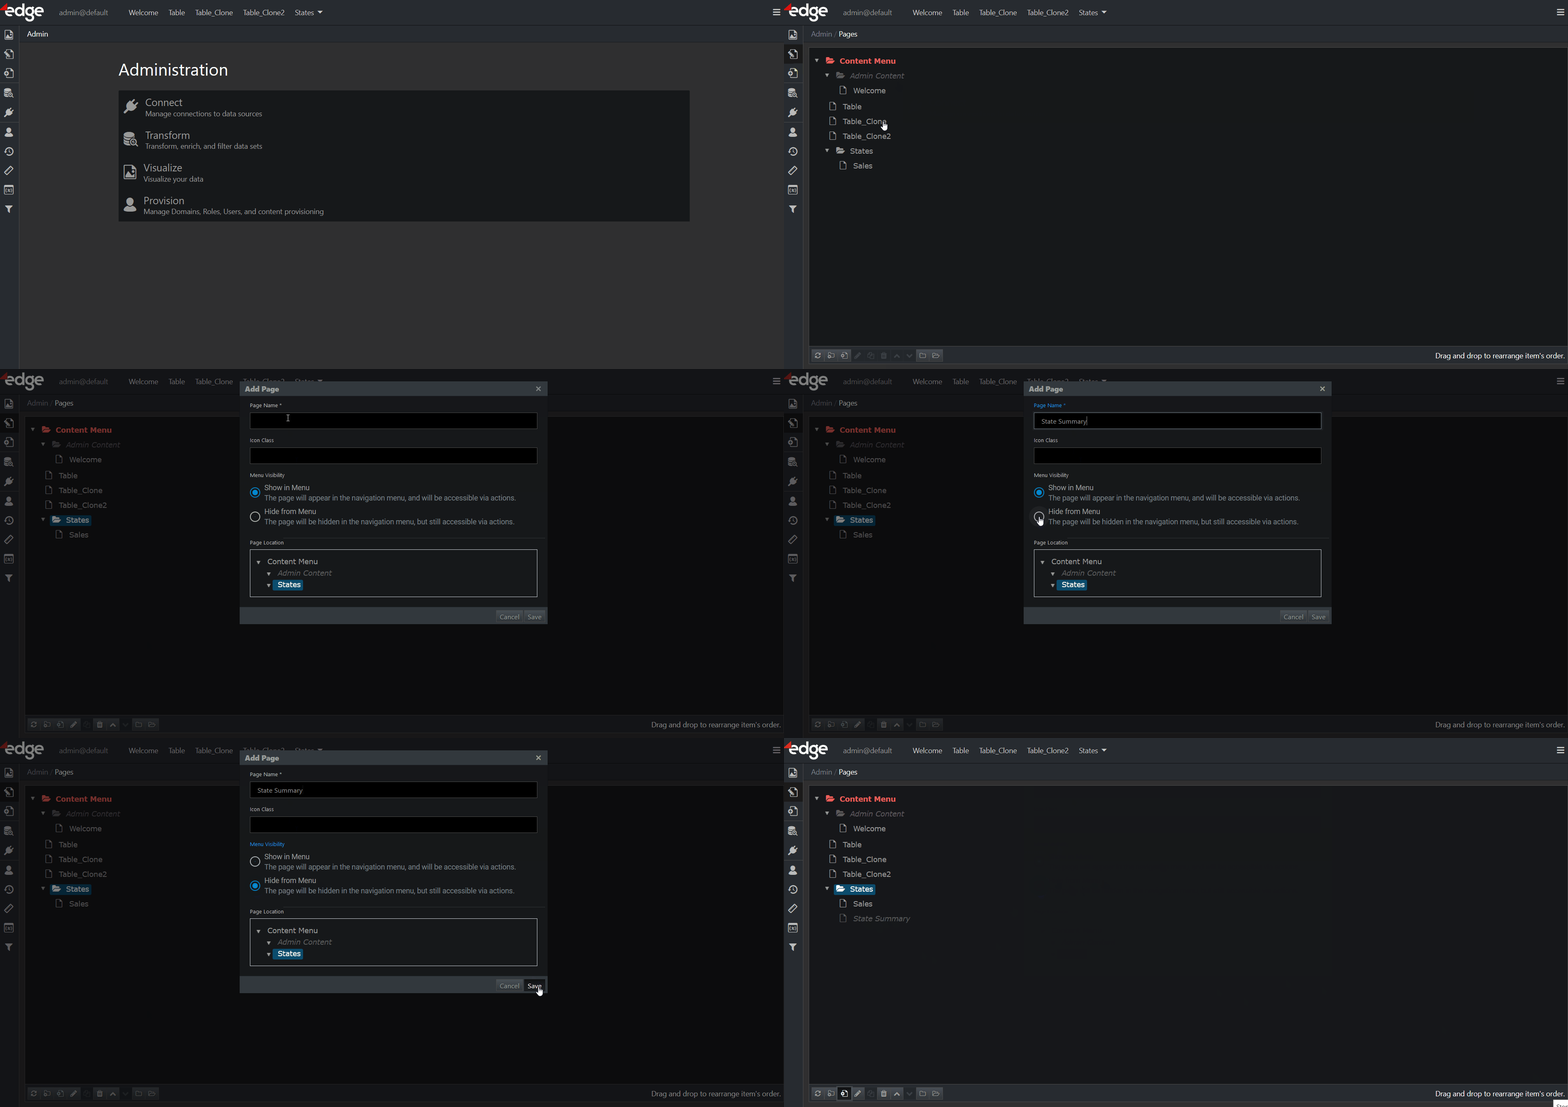
Switch to Page Action
Now that you have everything in place on your new page, the final step in creating your Switch to Page action is to configure the action that will switch to the new page when a user clicks a node on the map.
Perform the following steps to configure the action:
- In the upper banner area, click States > Sales.
The Sales page is displayed. - Click Edit in the upper right corner.
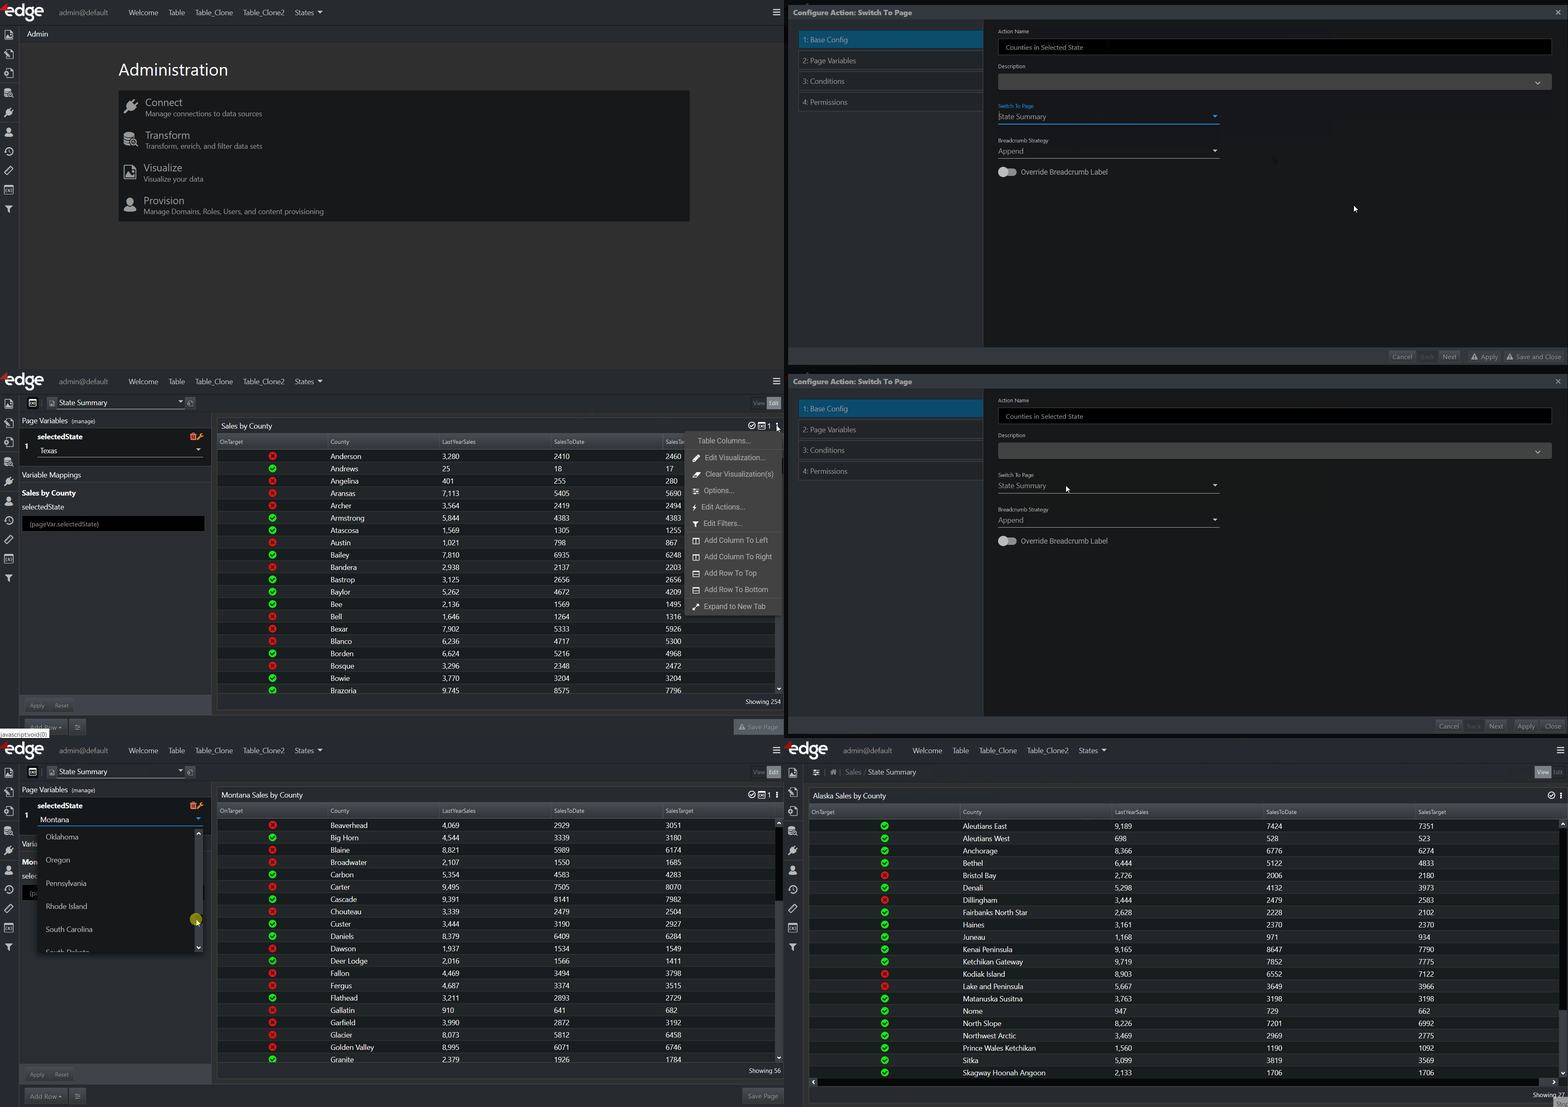
You are now in the Edit mode. - In the State Summary visualization, click the three dots and select Edit Actions.
A pop-up is displayed. - In the pop-up, click + > Click Marker > Switch To Page.
A new page is displayed. - On the Base Config tab, do the following:
a) In Action Name, enter Counties in Selected State.
b) From the Switch To Page drop-down, select State Summary.
c) Click Next. You are taken to the Page Variables tab. - On the Page Variables tab, click Next.
Note: you will configure this later. - On the Conditions tab,no changes are needed, so click Next to proceed.
On the Permissions tab, you can exclude certain roles from accessing the action you are creating, but in this case, leave the Allow all users access to action toggle switch on. - Click Save and Close and then close the pop-up.
- Click any node on the State Summary visualization to switch to the State Summary page.
A new page is displayed. - Click anywhere in the +Add Visualization(s) box.
A pop-up is displayed. - In the pop-up, do the following:
a) In the filter field, select View All to show the full pipeline.
b) Click the Sales By County table visualization to select it.
c) Click Add Visualization. The table visualization is displayed. - In the Sales By County table visualization, click the three dots and select Options.
A new page is displayed. - On the Configure Visualization Instances page, do the following:
a) In Visualization Label, enter {pageVar.selectedState} Sales By County.
b) Click Save.
c) Click Close. - From the page selector drop-down (where State Summary is currently selected), select Sales to return to the Sales page.
- In the State Summary visualization, click the three dots and select Edit Actions.
A pop-up is displayed. - Click Counties in Selected State to select it and then click the pencil icon.
A new page is displayed. - Click Next to go to the Page Variables tab.
- On the Page Variables tab, do the following:
a) From the selectedState drop-down, select Record Value and State.
b) Click Save and Close. - Click any node in the State Summary visualization to switch to the State Summary page.
On the State Summary page, only the counties from the selected state are displayed. - From the selectedState page variable drop-down, select Iowa and click Apply in the bottom left corner.
The list of counties is updated to show counties from Iowa. The name of the table visualization is updated to Iowa Sales By County. - Return to the Sales page by selecting Sales from the page selector drop-down.
- Go to the View mode. By clicking any node in the State Summary visualization, you will switch to the State Summary page where only the counties from the selected state will be displayed.
Summary
You have created several actions and variables that enable the user to interact with edgeCore. The mouse-over tooltips provide immediate additional detail on selected items. The click action takes the user to another page and dynamically filters the data based on selection. You also learned how to use constraints to ensure that users enter appropriate values for a variable. In the next exercise, you will create a user and give them content to work with so they can log in to edgeCore.
For more information on actions, refer to the corresponding chapter.