edgeCore version: 4.4.1
This feature enables you to further customize charts by using the HighCharts JSON configuration and also to access the data inside the configuration by running JavaScript ${...}$.
When running JavaScript, the following is available:
rows: array of objects that is the dataset;columnData(columnId): an array of values that represent the values in that column of data (see example below);moment: moment.js object for date/time conversions;
Enabling Advanced Mode
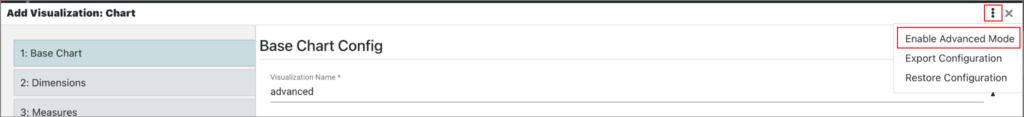
Enabling the advanced mode in chart visualizations is done by first clicking the three dots in the top-right corner and then the corresponding option. Once this mode is enabled, a new wizard step will appear (see example below).
Example
For the purpose of this example, we are going to use this CSV file containing wind data. After creating a CSV feed, we are going to create a chart visualization that will use the advanced configuration to access data from the dataset and separate the wind speeds on the Y-axis into categories.
Once we start configuring the chart visualization, we are going to enable the advanced mode in the top-right corner.
A new wizard step Advanced Config is displayed after the Series tab, enabling you to provide a JSON options object for HighCharts.
NOTE: If you delete all the series, that will trigger special behavior that will only use your configuration to render the chart. It will bypass all the settings and options the widget would normally set. This allows you to take full control over setting the series and style.
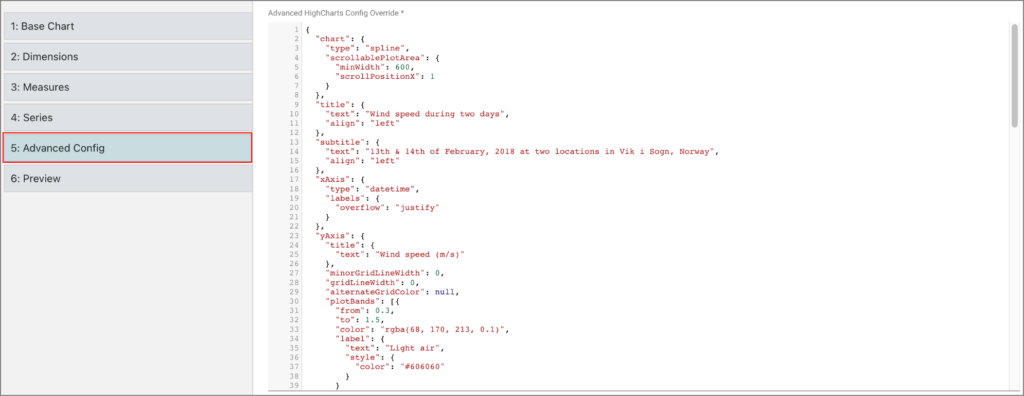
In the Advanced Config tab, we are going to use HighCharts’ configuration options for chart, title, subtitle, xAxis, yAxis, tooltip, plotOptions, series, and navigation. We are also going to access values from columns (lines 122 and 126):
{
  "chart": {
    "type": "spline",
    "scrollablePlotArea": {
      "minWidth": 600,
      "scrollPositionX": 1
    }
  },
  "title": {
    "text": "Wind speed during two days",
    "align": "left"
  },
  "subtitle": {
    "text": "13th & 14th of February, 2018 at two locations in Vik i Sogn, Norway",
    "align": "left"
  },
  "xAxis": {
    "type": "datetime",
    "labels": {
      "overflow": "justify"
    }
  },
  "yAxis": {
    "title": {
      "text": "Wind speed (m/s)"
    },
    "minorGridLineWidth": 0,
    "gridLineWidth": 0,
    "alternateGridColor": null,
    "plotBands": [{
      "from": 0.3,
      "to": 1.5,
      "color": "rgba(68, 170, 213, 0.1)",
      "label": {
        "text": "Light air",
        "style": {
          "color": "#606060"
        }
      }
    }, {
      "from": 1.5,
      "to": 3.3,
      "color": "rgba(0, 0, 0, 0)",
      "label": {
        "text": "Light breeze",
        "style": {
          "color": "#606060"
        }
      }
    }, {
      "from": 3.3,
      "to": 5.5,
      "color": "rgba(68, 170, 213, 0.1)",
      "label": {
        "text": "Gentle breeze",
        "style": {
          "color": "#606060"
        }
      }
    }, {
      "from": 5.5,
      "to": 8,
      "color": "rgba(0, 0, 0, 0)",
      "label": {
        "text": "Moderate breeze",
        "style": {
          "color": "#606060"
        }
      }
    }, {
      "from": 8,
      "to": 11,
      "color": "rgba(68, 170, 213, 0.1)",
      "label": {
        "text": "Fresh breeze",
        "style": {
          "color": "#606060"
        }
      }
    }, {
      "from": 11,
      "to": 14,
      "color": "rgba(0, 0, 0, 0)",
      "label": {
        "text": "Strong breeze",
        "style": {
          "color": "#606060"
        }
      }
    }, {
      "from": 14,
      "to": 15,
      "color": "rgba(68, 170, 213, 0.1)",
      "label": {
        "text": "High wind",
        "style": {
          "color": "#606060"
        }
      }
    }]
  },
  "tooltip": {
    "valueSuffix": " m/s"
  },
  "plotOptions": {
    "spline": {
      "lineWidth": 4,
      "states": {
        "hover": {
          "lineWidth": 5
        }
      },
      "marker": {
        "enabled": false
      },
      "pointInterval": 3600000,
      "pointStart": "${Date.UTC(2018, 1, 13, 0, 0, 0)}$"
    }
  },
  "series": [{
    "name": "Hestavollane",
    "data": "${columnData('Hestavollane')}$"

  }, {
    "name": "Vik",
    "data": "${columnData('Vik')}$"
  }],
  "navigation": {
    "menuItemStyle": {
      "fontSize": "10px"
    }
  }
}
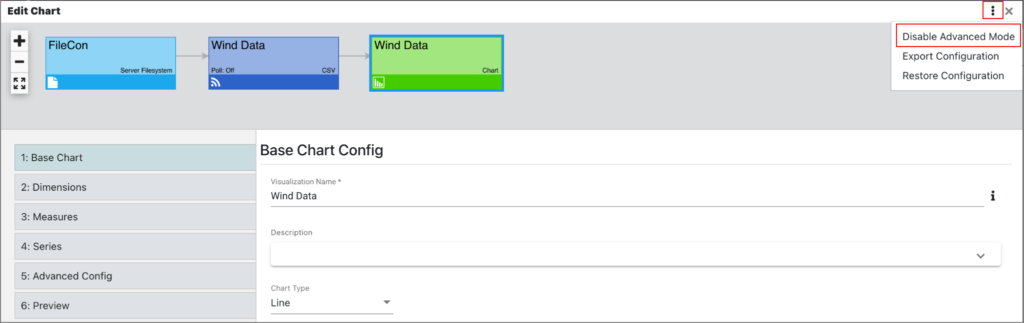
Disabling Advanced Mode
Once this mode is activated, it can be easily deactivated by first clicking the three dots in the top-right corner and then the Disable Advanced Mode option.
Known Issue
If you are using the Advanced Mode, edgeCore’s tooltip/hover action will not work correctly. We recommend you handle the tooltip action via the advanced configuration mode.
edgeCore Version 4.8.2
By default, edgeCore’s native tooltips are used in advanced chart mode, unless you enable HighCharts tooltips:
“tooltip”: {
“enabled”: true
Getting Extended Data
edgeCore version: 4.8.2
To get extended data used for edgeCore’s tooltip, replace columnData with columnDataExtended
columnDataExtended: (xAxis: string, columnId: string)
Example:
"series": [
    {
        "name": "Hestavollane",
        "data": "${columnDataExtended('datetime', 'Hestavollane')}$"

    },
    {
        "name": "Vik",
        "data": "${columnDataExtended('datetime', 'Vik')}$"
    }
],
Displaying Formatted Tooltip
edgeCore version: 4.8.2
Use the following snippet in HighChart advanced configuration object to display a formatted tooltip:
  "tooltip": {
    "enabled": true,
    "useHtml": true,
	"formatter": "${function() {return `<strong>${this.series.name} : ${this.y}</strong><br/>attributeName: ${this.point.pData.attributeName}<br/>X: ${this.x}<br/>` }}$"
  },
Note: attributeName refers to the attribute from your data; pData represents the PointData as an actual record;