A JSON Feed will parse target JSON data and bring in a tabular dataset. The feed will be designated as a JSON feed in the data pipeline as seen in the screenshot. You can download the StateData json file and follow the steps outlined below.
Configuring JSON Feed
Step 1: Create a Connection
Perform the following steps to connect to a data directory on the local server:
- Go to the Pipeline.
- Click + Add Connection in the upper-left corner.
A pop-up for choosing a connection type is displayed. - In the pop-up, select File / Server Filesystem connection type.
- Click Use Selected.
A new page is displayed. - In Connection Name, enter a name for the connection (for example, States).
- Make sure the Enable Connection toggle is on.
- In Server Path, provide a relative path from the installation folder of edgeCore. For the purpose of this example, you can leave the field as is.
- Click Next.
You are taken to the Test Connection tab where the confirmation message Connection test was successful is displayed. - Click Save and Close.
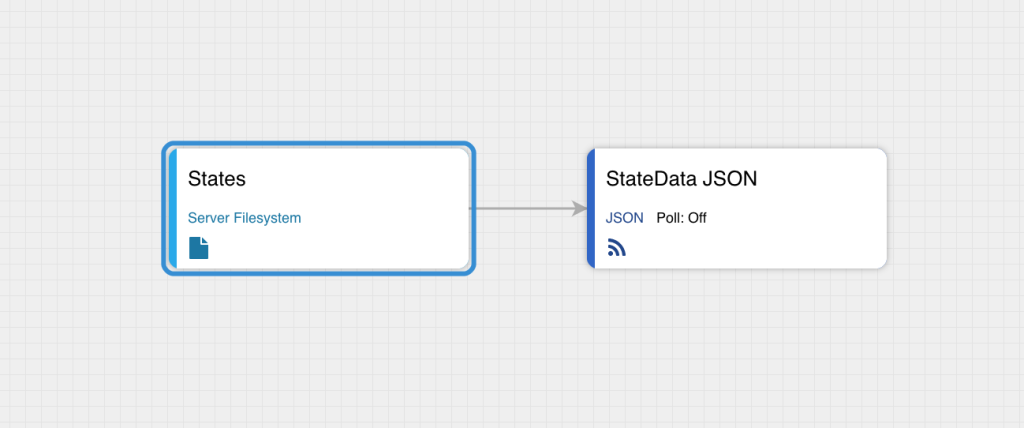
The newly created connection is displayed in the Pipeline.
Step 2: Create a JSON Feed
Now that you have established a connection to a directory of files, you can create a Feed from a specific JSON file.
Perform the following steps to create a JSON Feed:
- Go to the pipeline again and find the connection you have previously created.
- Hover over the connection for the gear icon to appear on the right.
- Click the gear icon button in the connection box and select + .
A pop-up for choosing a Feed Type is displayed. - In the pop-up, select JSON.
A new page is displayed. - On the Base Configuration tab, do the following:
a) In File Name, click the upload button and upload the StateData json file.
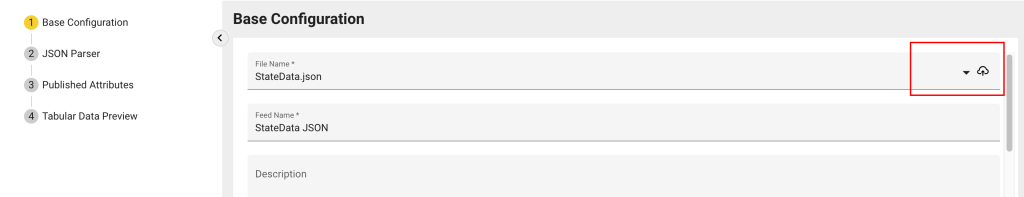
b) In Feed Name, enter a name for the feed.
c) (Optional) Provide a description.
d) In File Encoding, select the encoding of the file. For the purpose of this example, we have used UTF-8.
e) Enable or disable the Preserve Data Types toggle switch. If enabled, data types defined in the data source will be preserved. If disabled, all values will be interpreted as strings. For the purpose of this example, we have enabled this option.
f) Enable or disable the Convert Null Values to Empty Strings toggle switch. If enabled, null values will be converted to empty strings. For the purpose of this example, we have left this option disabled.
g) In Attribute Depth Limit, specify how many levels of nesting the server will go when parsing the data. Higher values can lead to longer processing times if the data contains deeply nested objects. For the purpose of this example, we have set this limit to 3.
h) In Record Sample Limit, specify the number of records evaluated by the server during attribute discovery and data preview. Lowering this value may improve processing times when dealing with exceptionally large data sets. To disable the limit, set the value to -1. For the purpose of this example, we have set this limit to10.
i) (Optional) Enable the Advanced Update Scheduling toggle switch if you want to define an advanced schedule for updates.
j) In Poll Interval, specify how often you can access the data for a feed and also how often the data changes (in seconds). If a server subscription is active (another user is using that node or a server job is making it active), the current data retrieved will be returned. It will not refresh until all server-side subscriptions are closed and a new one is open. If you set the poll interval to 0, that means the data is very static, and you do not expect it to change. For the purpose of this example, we have set this interval to 0.
k) (Optional) Turn on the Enable Server Subscription toggle switch in order for data for this feed to be continually fetched, updated, and cached based on the Poll Interval. If enabled, the server will subscribe to the feed, just as a client widget would. This means that the data and any resources that would otherwise be allocated “on-demand” for the first user to view a Visualization that leverages the data produced by this feed are allocated when the server is started and maintained as long as this feed is configured.
l) (Optional) Enable the Persist toggle switch to use persistent table store.
m) (Optional) Enable the Publish Dataset via REST API toggle switch to allow other edgeCore servers or third-party software to connect to this server’s pipeline.
n) Click Next. You are taken to the JSON Parser tab. - The JSON Parser tab consists of the following:
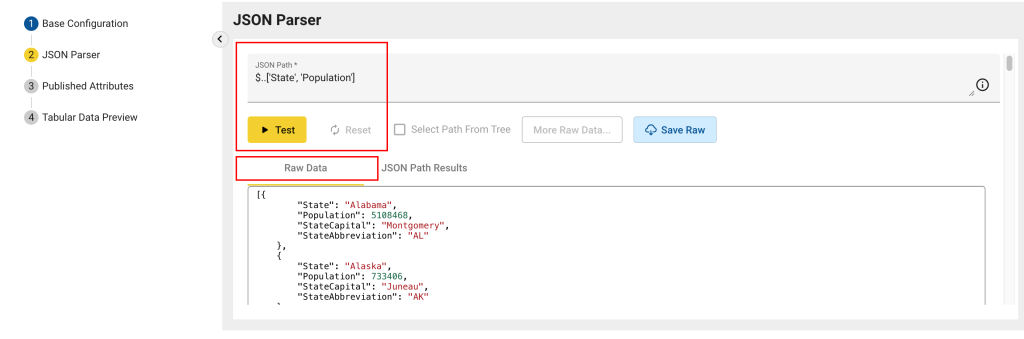
a) JSON Path: here you define how to parse the target JSON data; Use Goessner’s JSON Path to select portions of the JSON you want to include in the resulting dataset. For the purpose of this example, we have used $..[‘State’, ‘Population’]
b) Raw Data: shows the raw JSON data from the source file. Use this tab as a reference when writing the JSON Path syntax.
Example:
c) JSON Path Results: shows the resulting JSON data after parsing it with the supplied JSON Path syntax. To update, click the Test button in the JSON Path field, then toggle back and forth between Raw Data and JSON Path Results to validate your JSON Path syntax and click the checkbox next to Select First Level Only.
Example:
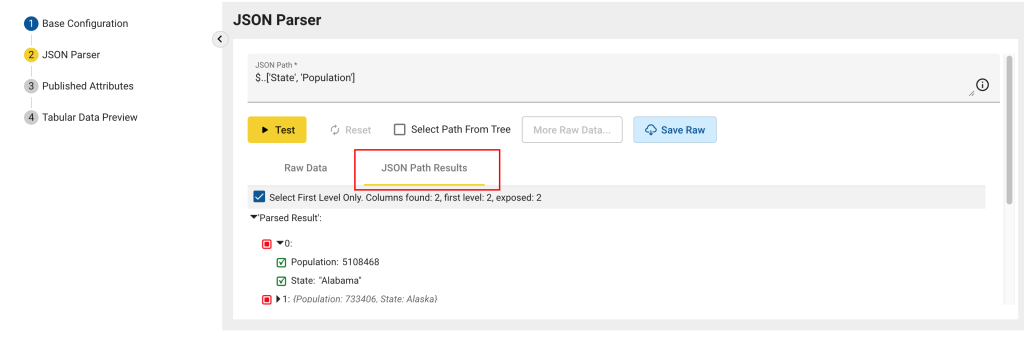
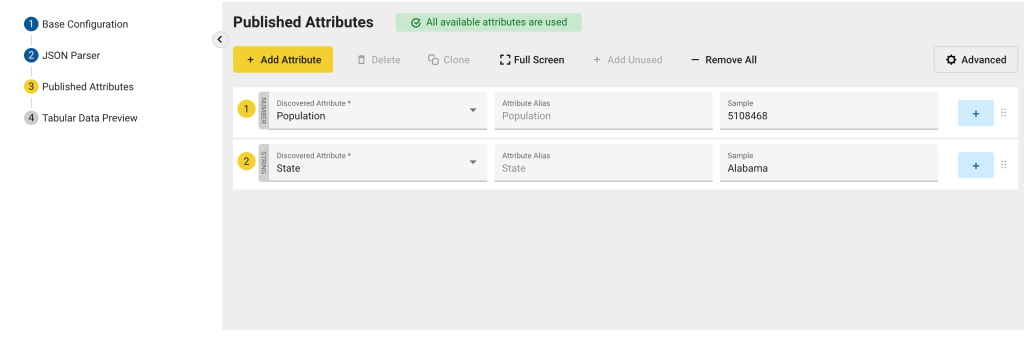
d) Parsed Result: shows a list of all discovered attributes from the JSON Path Results. Any attributes in this list will be used in converting the data to a tabular format.
e) Save Raw: enables you to save a copy of the raw data as a JSON file. The file will be downloaded directly to the local machine, similar to any other file that one would download from the browser.
f) Click Next. You are taken to Published Attributes where the attributes we selected in JSON Path are displayed.
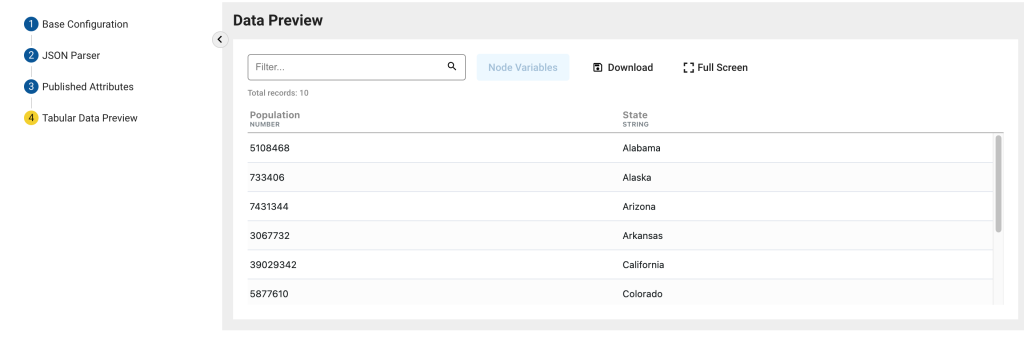
g) Click Next to go to the Tabular Data Preview where you can observe the data preview of your JSON Feed.
- Click Save and Close.
The newly created feed is displayed in the Pipeline.
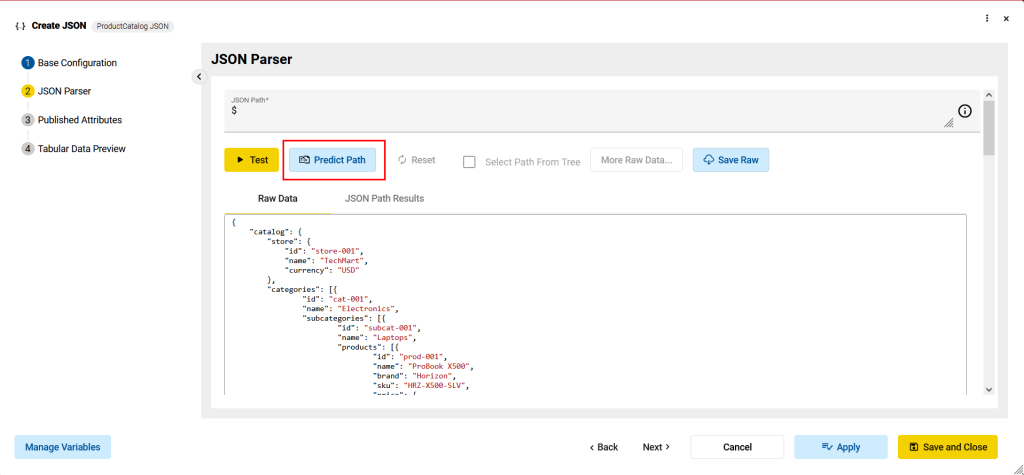
Path Prediction
edgeCore version: 5.1.2
The Predict Path button makes it easier to determine what the best JSON path should be.
For the purpose of this example, we have uploaded the product catalog JSON file.
- In JSON Parser tab, click Predict Path.
- The JSON Path field at the top is now defined, and you are taken to JSON Path Results.
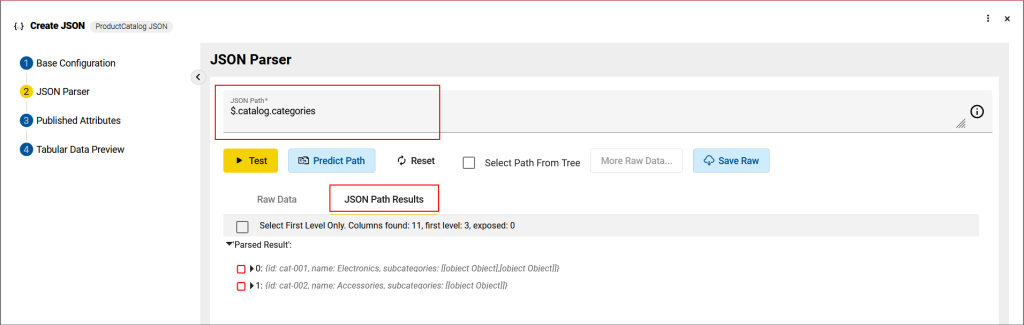
- Click the checkbox next to Select First Level Only.