edgeCore version: 5.1.1
The AI Notebook transforms how you work with data. Instead of writing queries, building charts, or learning complex tools, you just need to ask questions in plain language, with clear and specific instructions/prompts.
With the AI Notebook, you can:
- Transform datasets (for example, join two datasets)
- Build visualizations (pie chart, table, and line chart are currently supported)
- Ask for a single piece of data (for example, give me cities with a population greater than 100,000)
Prerequisites
- The AI Assistant needs to be enabled.
➤Linux/UNIX: when running the configure.sh script, enable AI ASSIST under Server Modes;
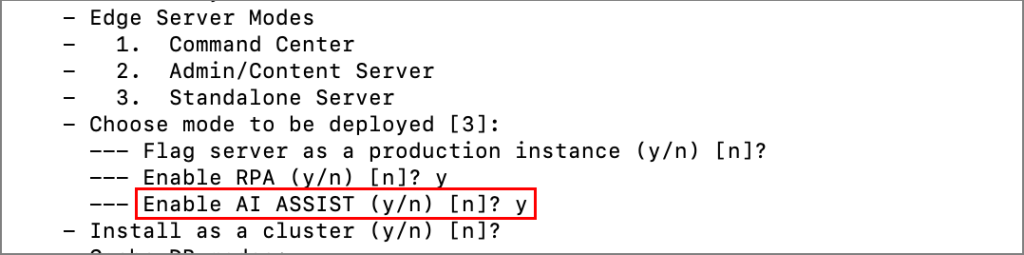
➤ Windows:
a) Go to the conf folder of your edgeCore build.
b) Open the environment.bat file.
c) In the bat file, find the following: rem set EDGE_SERVER_AI_ASSIST=true
d) Remove rem
e) Save the change and close the file.
- The data you want to use in the Notebook needs to be visualized and placed on a page.
- By default, only Full admin accounts have access to the Notebook.
If the admin wants other users/roles to use the Notebook, both the permission and content/page need to be assigned to that user/role.
The Notebook Permission
To allow other users to use the Notebook, the admin needs to assign the Notebook permission.
- Go to Provision Roles.
- Find the custom role you want to have access to the Notebook and click on it.
- On the right, click the Permissions tab.
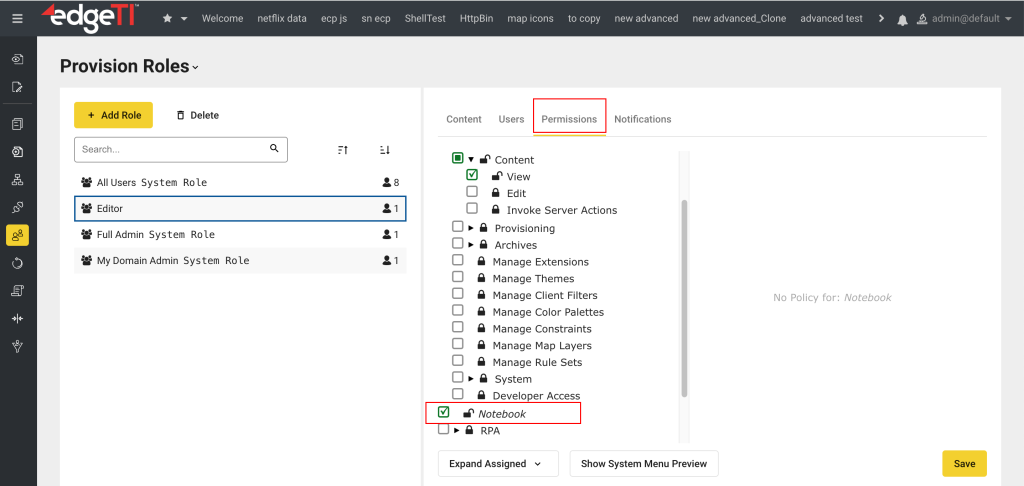
- Select the checkbox next to Notebook.
- Click Save.
In order for the user in this custom role to use the data in the Notebook, the content/page also needs to be assigned.
- Click the Content tab.
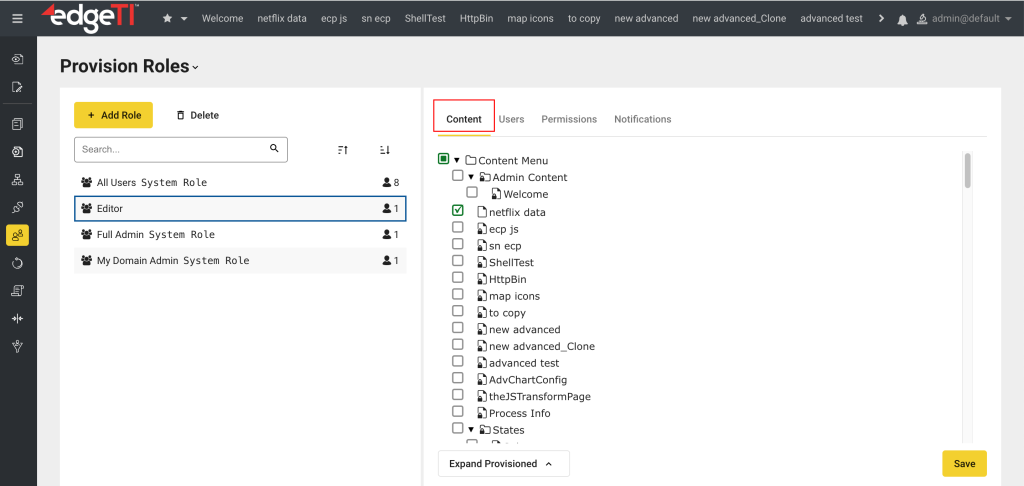
- Find the page(s) containing the data.
- Select the checkbox(es) next to the content/page name.
- Click Save.
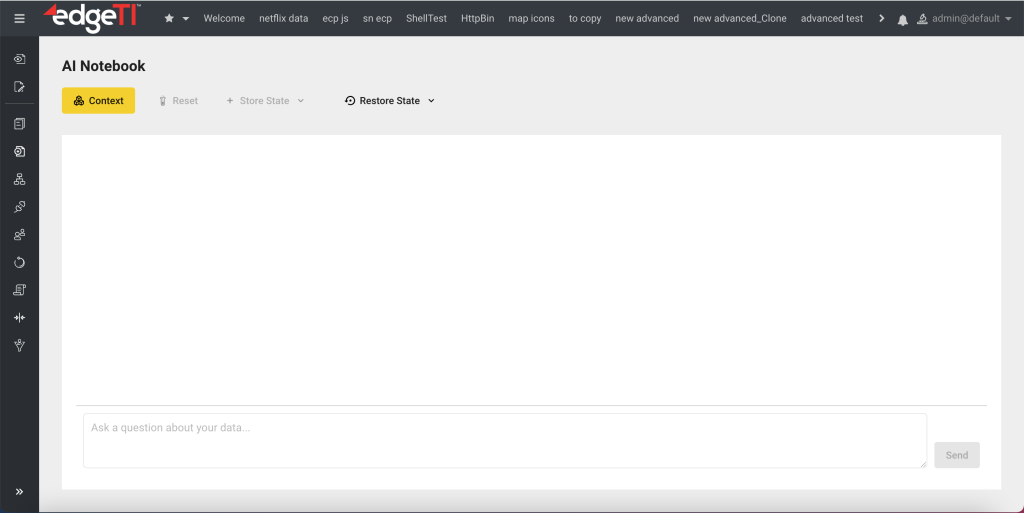
Accessing the AI Notebook
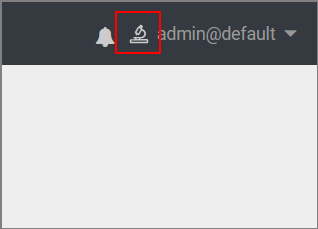
To access the Notebook, click the microscope icon in the top-right corner, between the Message center and your username@domain.
![]()
A new page is displayed where you select your data sources and interact with the AI, as demonstrated in the example below.
Example
For the purpose of this example, we are going to use this file containing the most popular shows on Netflix.
- Go to the pipeline and create a Server Filesystem connection.
- Off of the Server Filesystem connection, create an XLS/XLSX feed.
- Upload the most-popular_global_alltime.xlsx file.
- Go to the Data Preview and save the feed.
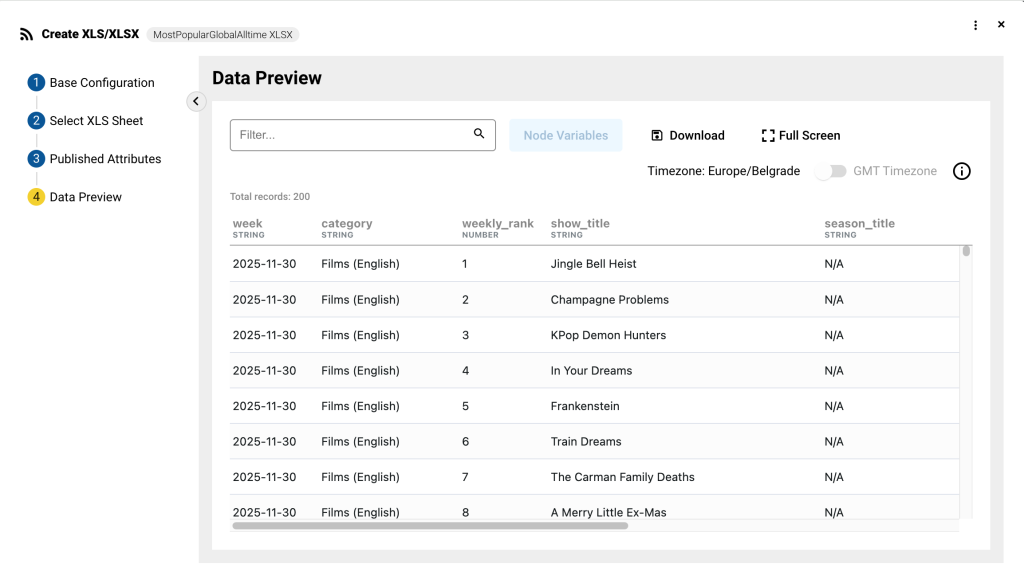
- Off of the created feed, create a table visualization.
- Save the visualization and create a page for it.
- Click the microscope icon to access the Notebook.
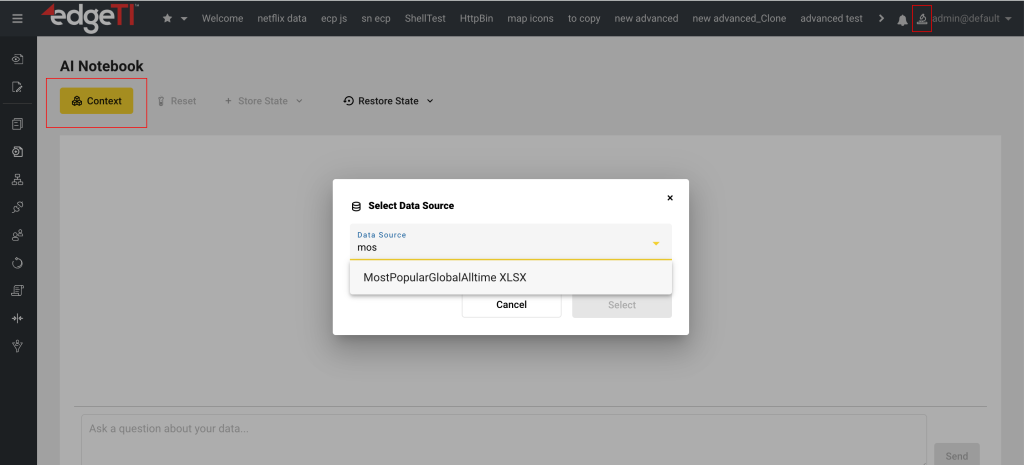
A new window is displayed. - To select the data source you want to work with, click Context.
A pop-up is displayed. You can select multiple data sources, however, we do not recommend more than 10. - Find the data source from the dropdown and click Select.
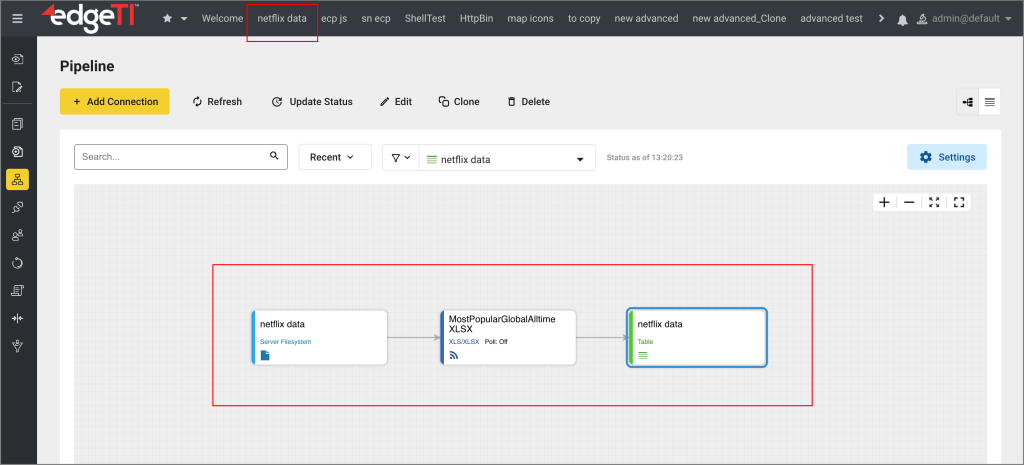
In our case, we are going to select our Netflix data, that is, the MostPopularGlobalAlltime feed.
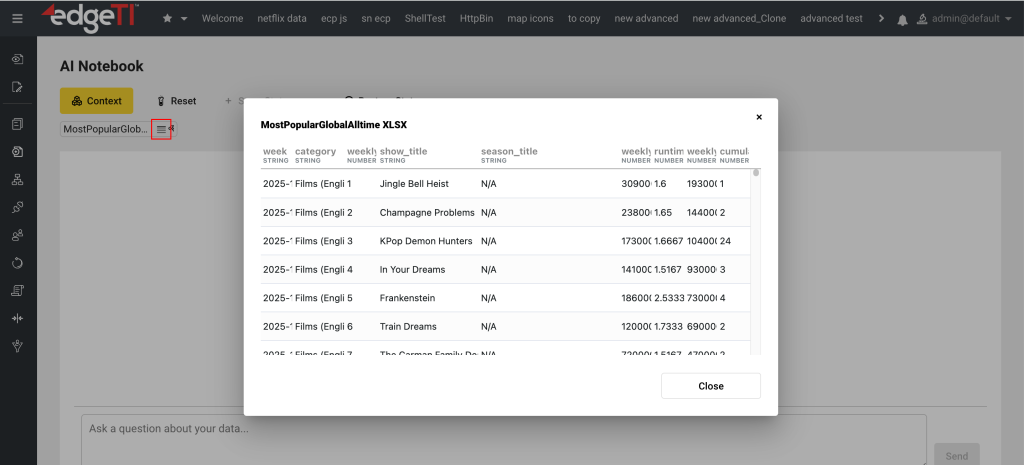
The selected data source will be displayed below the Context button. You can see a preview of the data source, as shown in the following screenshot. Alternatively, you can also remove the data from the context if you do not want to work with it.
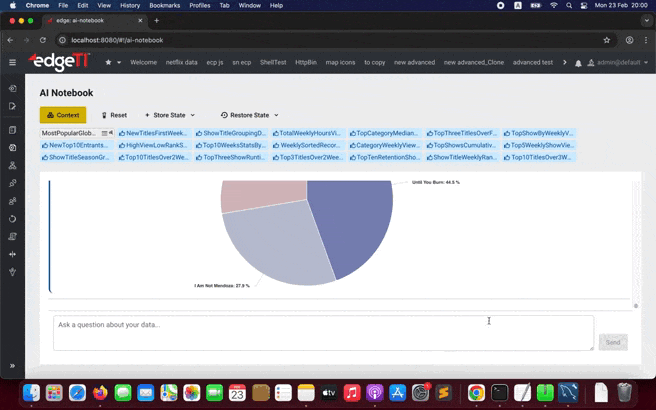
- In the input field at the bottom of the screen, write clear and concise questions/ instructions and hit Enter.
As stated above, you can ask the AI to transform the data, chart it, and/or retrieve a single piece of data. The AI-generated output will immediately be displayed in both the Notebook and the pipeline.
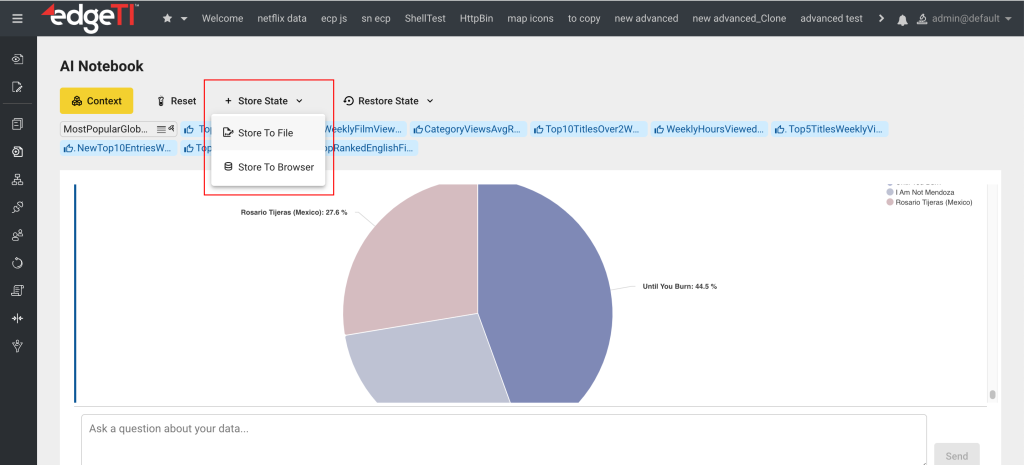
Note: if you go to any other page in edgeCore or click anything in the menu (that is, leave the Notebook) while working in the Notebook, the Notebook will reset, and you will have to start over. We suggest storing the state to either file or browser (as explained below).
Here are some of the prompts we have used for our data source:
- give me top 5 shows for weekly viewership
- Filter the dataset to show only titles that have been in the Top 10 for more than 2 weeks and sort them by weekly hours viewed descending.
- Identify any titles that are new to the Top 5 (cumulative_weeks_in_top_5 = 1).
- Group data by show_title
- top 3 shows when it comes to runtime
- display the show_title with the highest aggregated weekly_views
- What is the average rate of rank change per week for each show_title
- Which titles appeared in the Top 3 for more than 5 cumulative weeks?
- Create a summary table showing, for each category, the total weekly views and average runtime.
- Which high-view shows have lower rankings
- Calculate the total weekly hours viewed across all Films (English) titles
- Which categories have the highest median weekly_views?
- create a pie chart for top 3 show runtimes
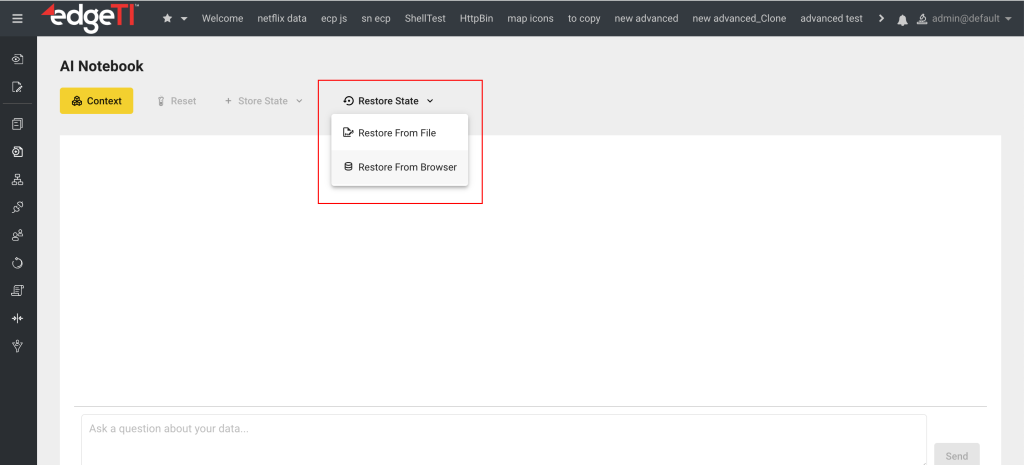
Storing and Restoring the Notebook State
The AI Notebook enables users to save their working state and restore it later. The Notebook state can be stored either locally in the browser or exported as a JSON file. The stored state represents the current notebook session state, including AI prompts and generated outputs.
The Notebook state can be restored either from a browser-stored session or the previously exported JSON file. Upon restore, the system restores prompts and AI-generated outputs.
Note: When restoring the state from a file, make sure the data/page is present in edgeCore, that is, the specific content has been restored. If the content is not available, a pop-up will notify you that there was a problem retrieving the AI Notebook state and that you should check if the required data is restored.
Limitations:
– If you have pages with secVars and nodeVars, the AI-generated responses might not be good enough.
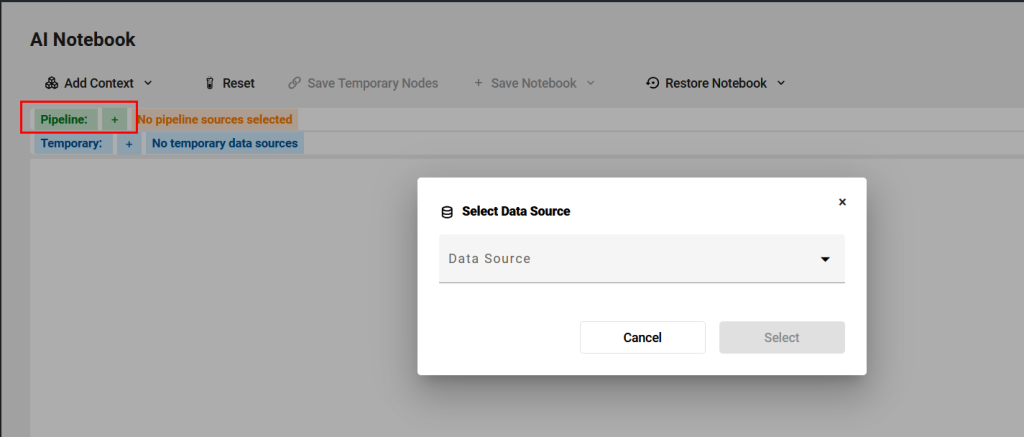
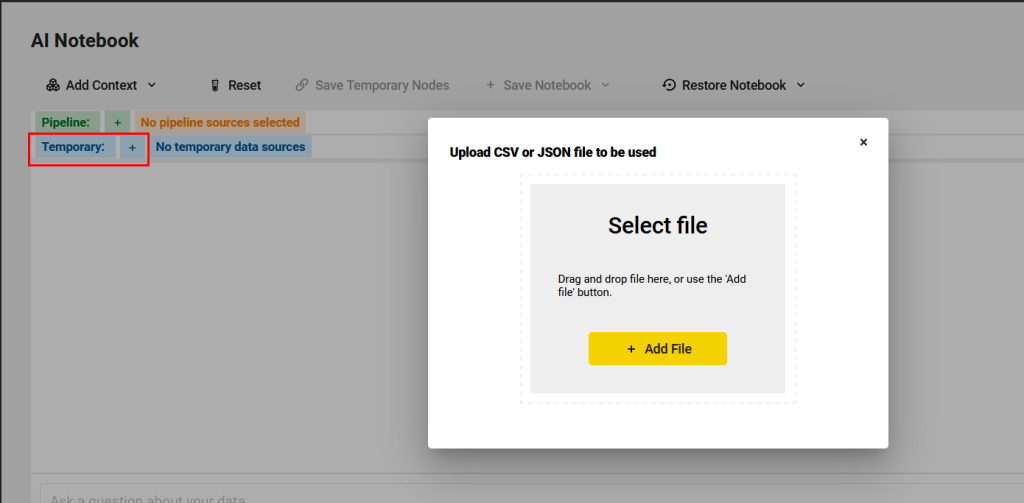
Adding Pipeline Sources and Temporary Files to AI Notebook
edgeCore version: 5.1.2
To add datasets from the pipeline, click + next to the Pipeline for the popup to appear.
To add temporary CSV or JSON files, click + next to Temporary for the popup to appear. These temporary files will be cleaned up after sessions close.
Example
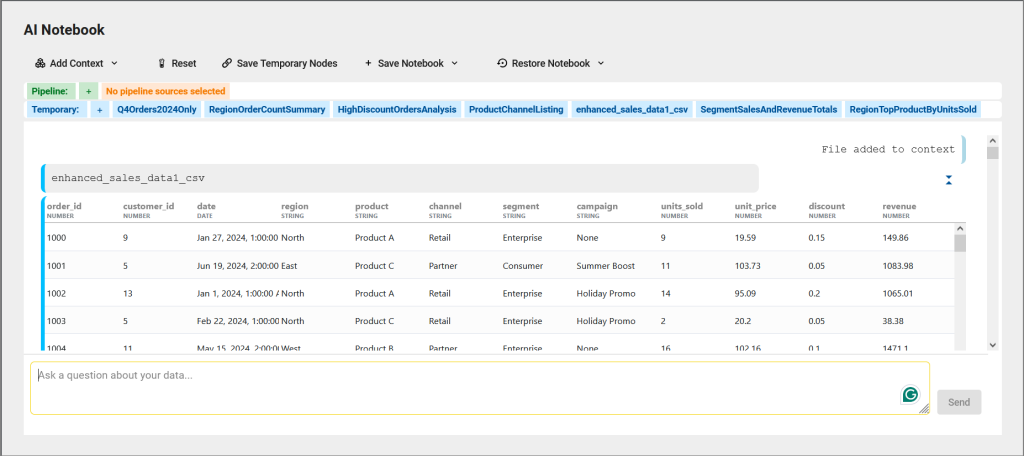
For the purpose of this example, you can download the enhanced sales csv file and upload it to the Notebook as a temporary data source.
This CSV dataset contains 50 simulated sales records that include information on customer orders across different regions, products, sales channels, customer segments, and marketing campaigns.
Once uploaded as a temporary source, the CSV data is displayed in the Notebook, as seen in the following screenshot.
Here are some prompts you can use:
- What is the total revenue generated across all orders in the dataset?
- List all distinct products and their respective channels.
- Calculate number of orders for each region
- What is the average discount applied per sales channel?
- Find product with the highest revenue
- Which campaign generated the highest average revenue per order? Exclude orders with no campaign (campaign = ‘None’).
- Calculate the total units sold and total revenue for each segment (Enterprise, SMB, Consumer).
- Identify all orders where the applied discount is higher than the average discount across all orders.
- For each region, find the best-selling product (by units sold).
- Add a new column revenue_per_unit calculated as revenue divided by units_sold.
- Filter the dataset to include only orders from Q4 2024 (October–December).
- Create pie chart showing total revenue by region
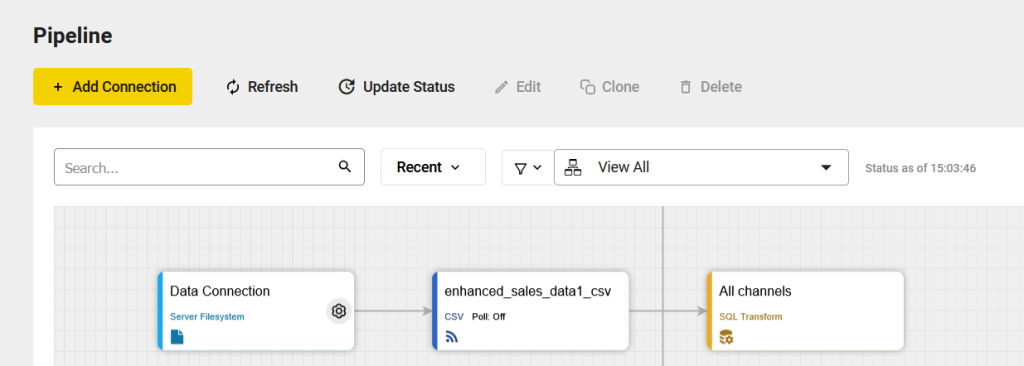
Saving Temporary Nodes as Persistent
You can save temporary nodes as persistent so they show up in the pipeline.
- Click Save Temporary Nodes.
A pop-up containing temporary nodes is displayed.
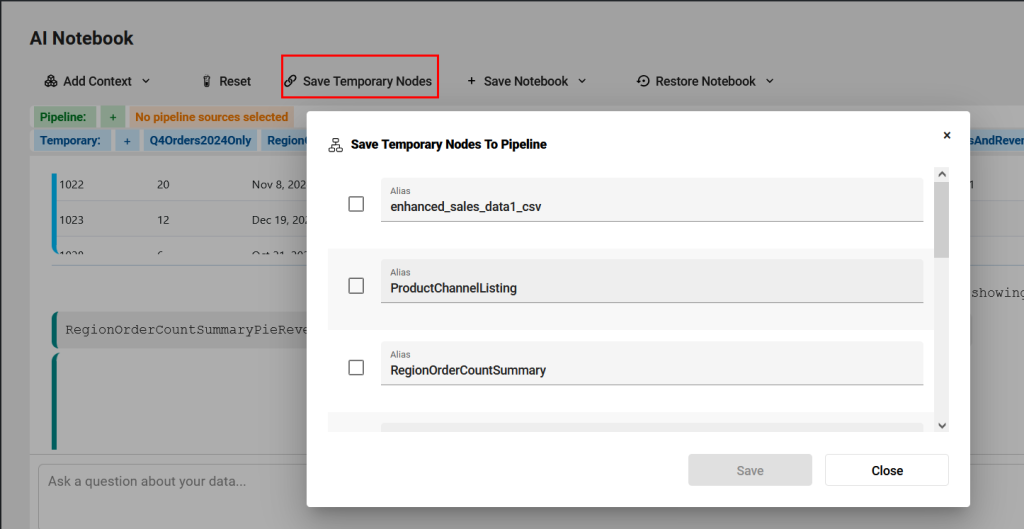
- Select the checkbox next to the Alias you want to save.
Note: Make sure you first rename the Alias. For example, we have renamed ProductChannelListing to All channels.
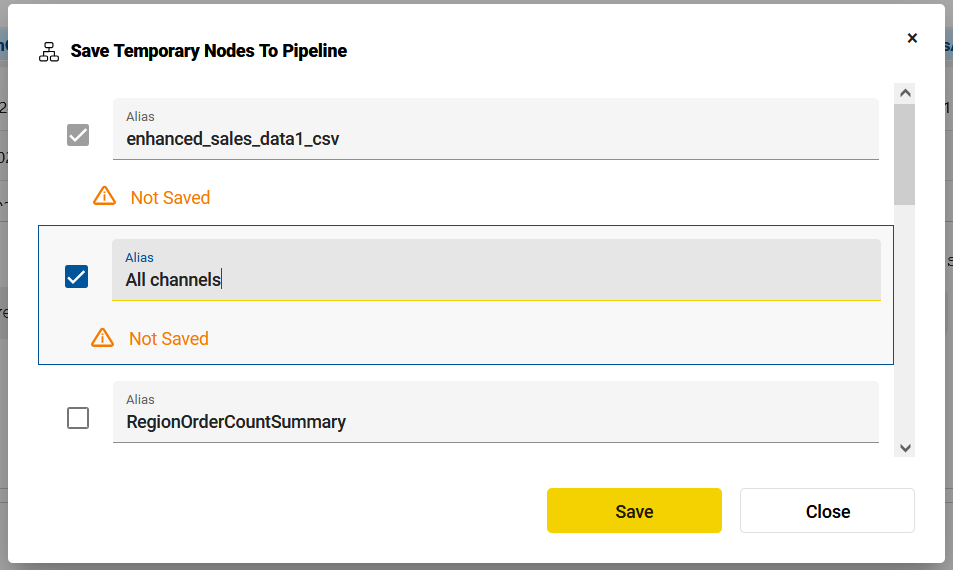
- Click Save and close the popup.
The saved node will be displayed in the pipeline.