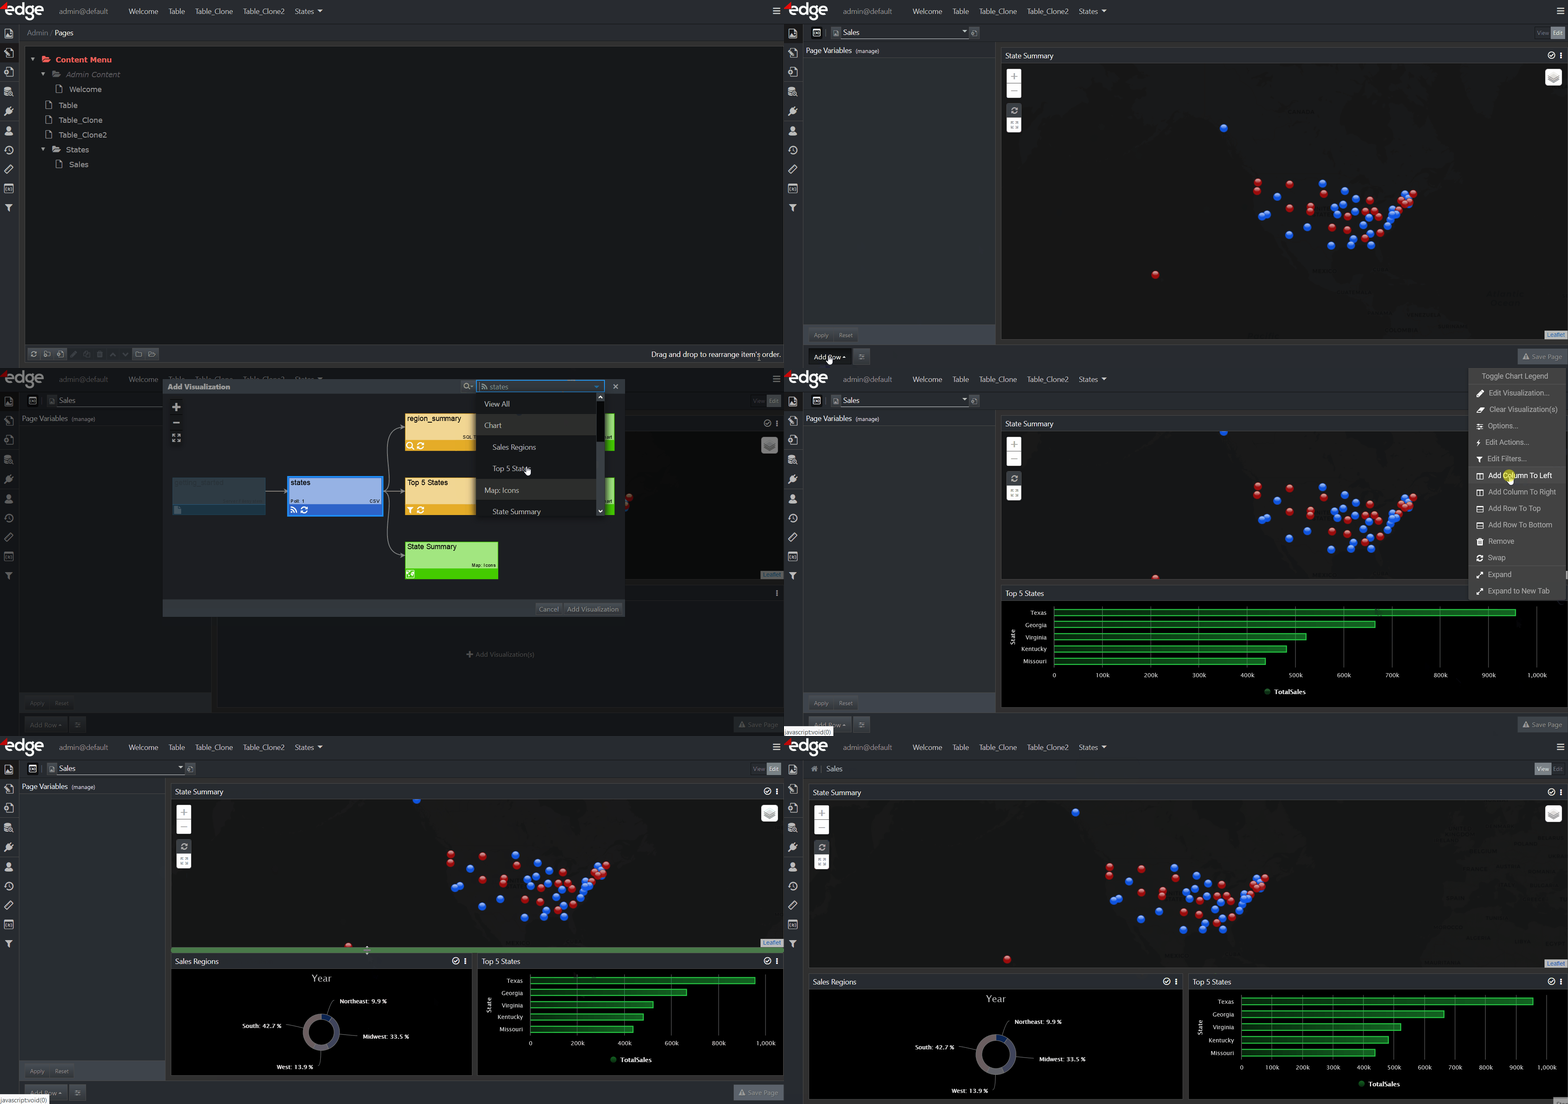
After creating a page, you need to add your three visualizations to that page. The page containing visualizations can then be provisioned to users for presentation when they log in.
Perform the following steps to add visualizations to the page:
- In the upper banner area, click States > Sales.
The empty Sales page is displayed. - Click Edit in the upper right corner.
You are now in the Edit mode. - Click anywhere in the +Add Visualization(s) box.
A pop-up is displayed. - In the pop-up, do the following:
a) In the filter field, select State Summary.
The State Summary map visualization is displayed in the pop-up.
b) Click Add Visualization. - In the bottom left corner, click Add Row > To Bottom.
The new row is displayed. - Click the lower border of the State Summary visualization and drag it up to use half the available area. Zoom in on the map and align it in the frame as desired.
- In the bottom row you just added, click anywhere in the +Add Visualization(s) box.
A pop-up is displayed. - In the pop-up, do the following:
a) In the filter field, select Top 5 States.
The Top 5 States bar chart visualization is displayed in the pop-up.
b) Click Add Visualization. - In the Top 5 States bar chart, click the three dots and select Add Column to Left.
A new column is displayed. - In the new column you just added, click anywhere in the +Add Visualization(s) box.
A pop-up is displayed. - In the pop-up, do the following:
a) In the filter field, select Sales Regions.
The Sales Regions pie chart visualization is displayed in the pop-up.
b) Click Add Visualization.
c) Adjust the size of all visualizations as you want. - Click Save Page.

Summary
You have created three different visualizations and laid them out on a page. Each one uses a different view of the same data, as configured in the earlier exercise. Next, you will enable some actions on visualizations, which will empower the user to control the data and navigation in real time.
For more information on Pages, refer to the corresponding chapter.
For more information on Visualizations, check out this chapter. Additionally, if you want to learn about custom visualizations, you may do so here.